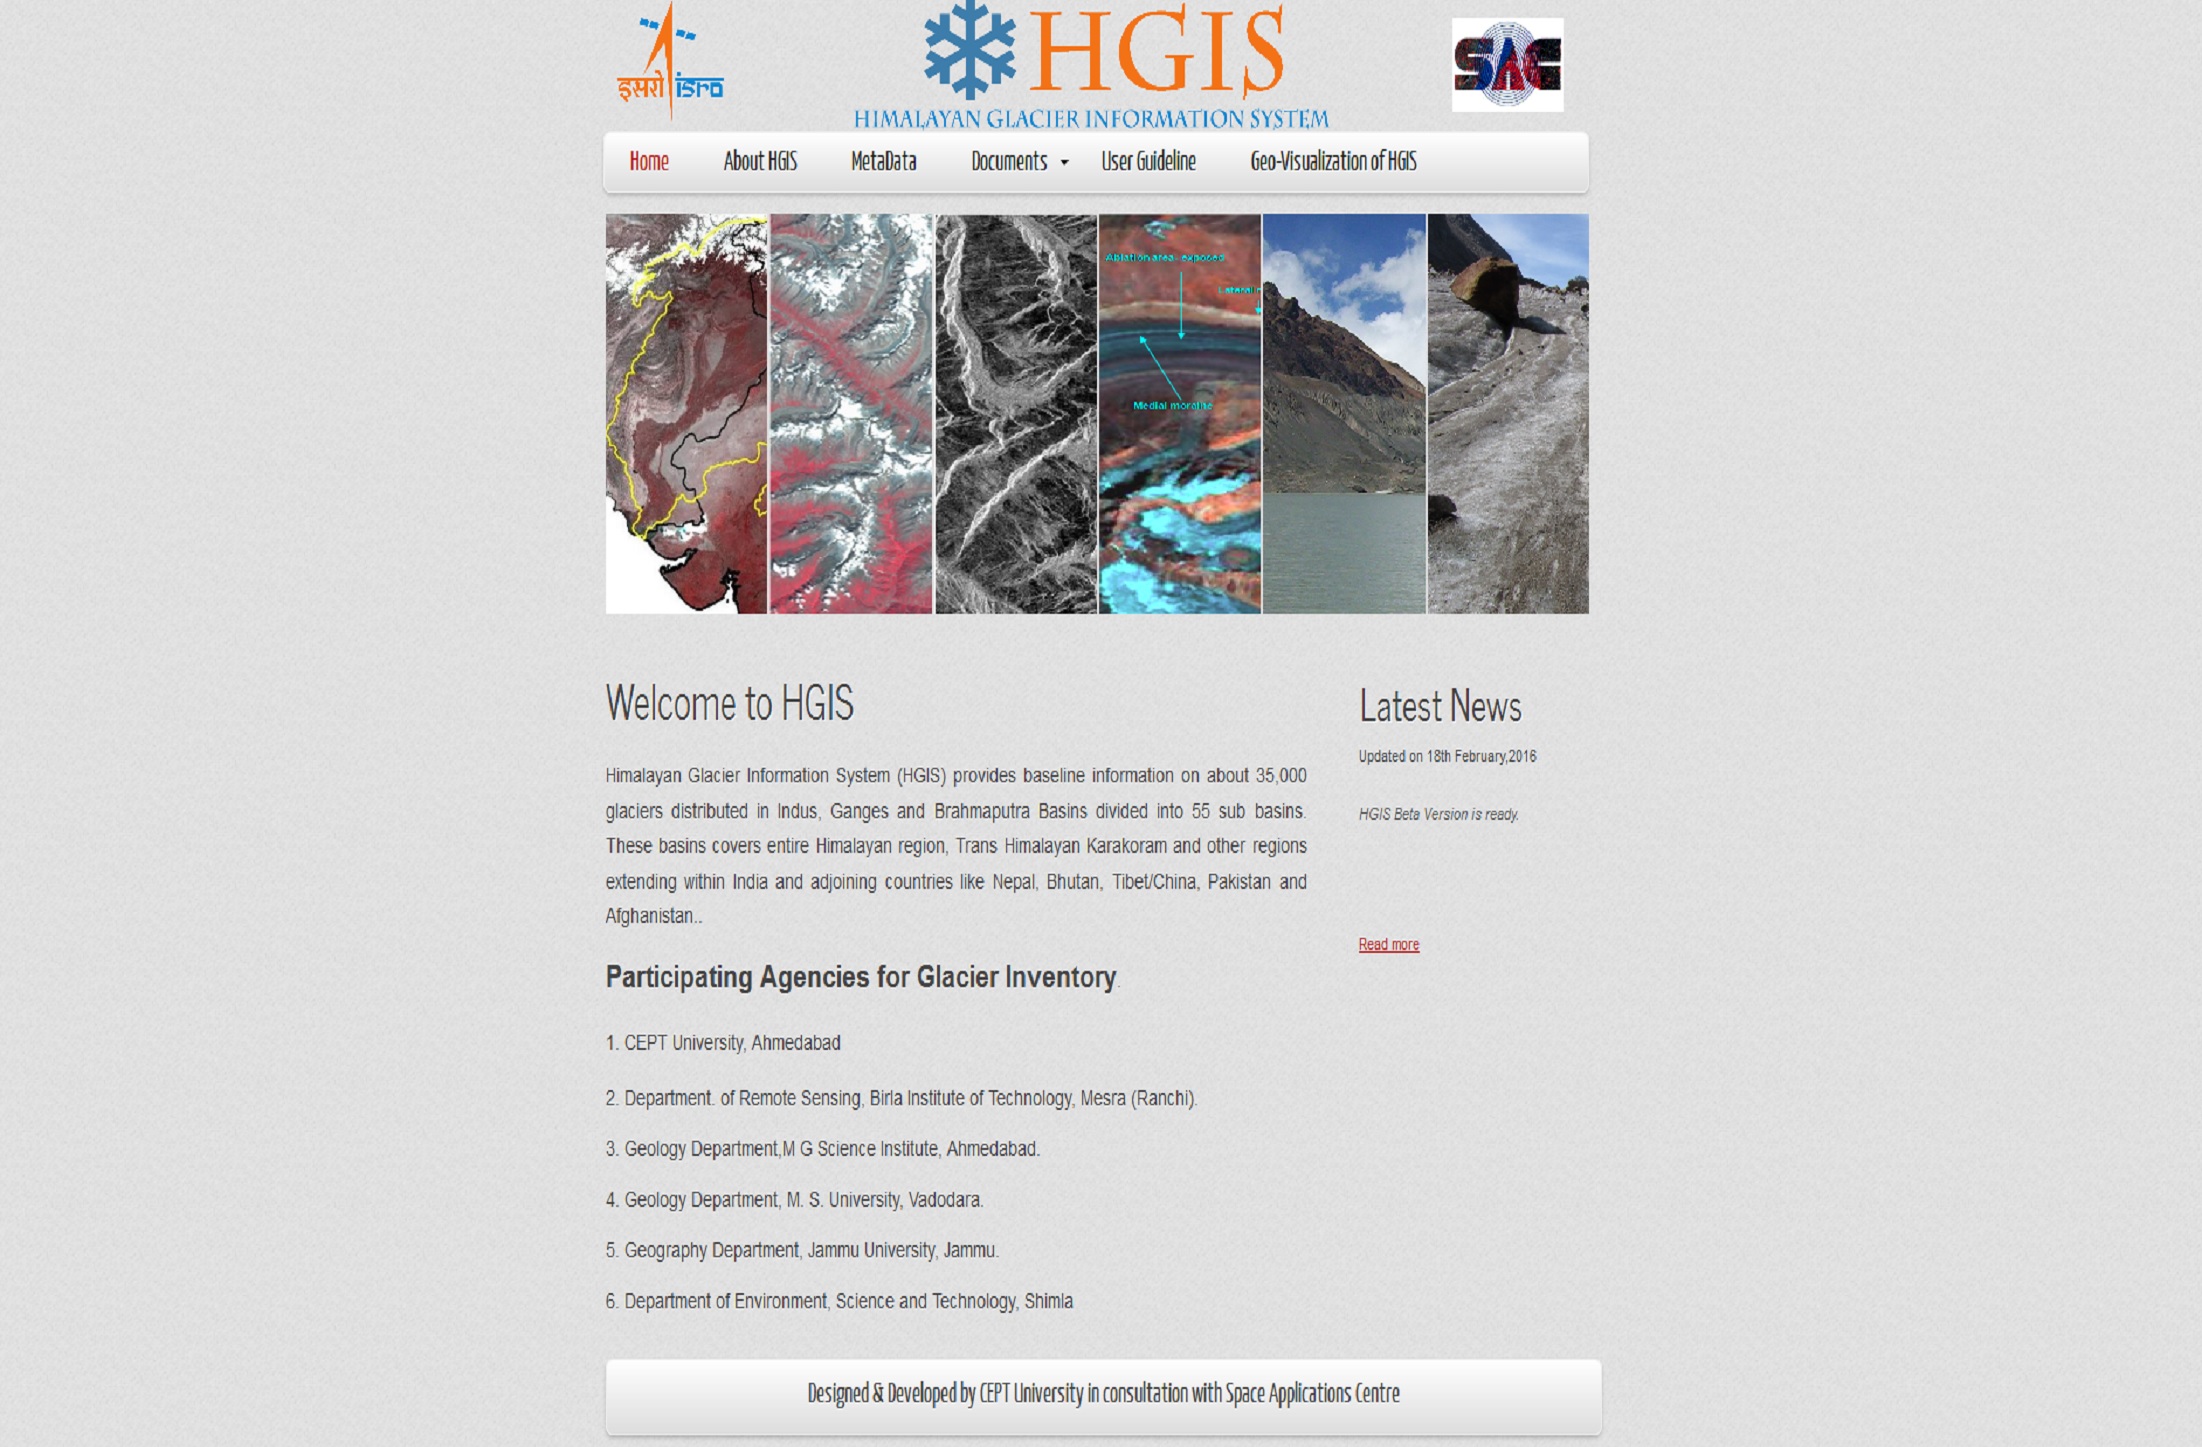
Himalayan Glacier Information System (HGIS) provides baseline information on about 35,000 glaciers of entire Himalayan region distributed in 3 major basins (Indus, Ganges, Brahmaputra Basins) and 55 sub basins. The glacier information is prepared from Indian remote sensing satellite Resourcesat-I LISS III / AWIFS data.
Introduction
Himalayan Glacier Information System (HGIS) provides baseline information on about 35,000 glaciers of entire Himalayan region distributed in 3 major basins (Indus, Ganges, Brahmaputra Basins) and 55 sub basins. The glacier information is prepared from Indian remote sensing satellite Resourcesat-I LISS III / AWIFS data.
HGIS Mainframe
Himalayan Glacier Information System Mainframe provides descriptive overview and latest information related to HGIS system.
HGIS System
Himalayan Glacier Information System represents a significant step towards mapping the data and information gap on the status of Glaciers in the Himalayan Region. HGIS provides a basis for assessing the rates of change of glaciers, which is important for understanding climate change, water resource planning, and mitigation of glacial lake outburst flood (GLOF) hazards.
Quick Start
Please read the topics to quickly get started with HGIS. The introductory topics will give you the brief overview of the HGIS concept. It requires just a couple minutes to see how it's easy and fun to extract glacier level information using Himalayan Glacier Information System.
Quick Start
Himalayan Glacier Information System Mainframe provides descriptive overview and latest information related to HGIS system.
Himalayan Glacier Information System Mainframe provides descriptive overview and latest information related to HGIS system. Mainframe is mainly divided into following parts:
1) Navigation - Top Navigation 2) Main Content 3) News and Events 4) HGIS System
Navigation
Navigation provides an easy way to get information about Himalayan Information System.
Topbar Navigation
Topbar Navigation mainly provides an easy way to get latest information, for example latest glacier related publications, Glacier site visit photo gallery etc. and it also provide a way to connect with HGIS authorities to provide feedback.
Main Content
Main Content provides information based on navigation selection.
News and Events
This section of web site provides latest information related to Himalayan Glacier Information.
HGIS System
Navigate to Himalayan Glacier Information System (HGIS).
Quick Start
Himalayan Glacier Information System represents a significant step towards mapping the data and information gap on the status of Glaciers in the Himalayan Region. HGIS provides a basis for assessing the rates of change of glaciers, which is important for understanding climate change, water resource planning, and mitigation of glacial lake outburst flood (GLOF) hazards.
HGIS System is mainly divided into following parts:
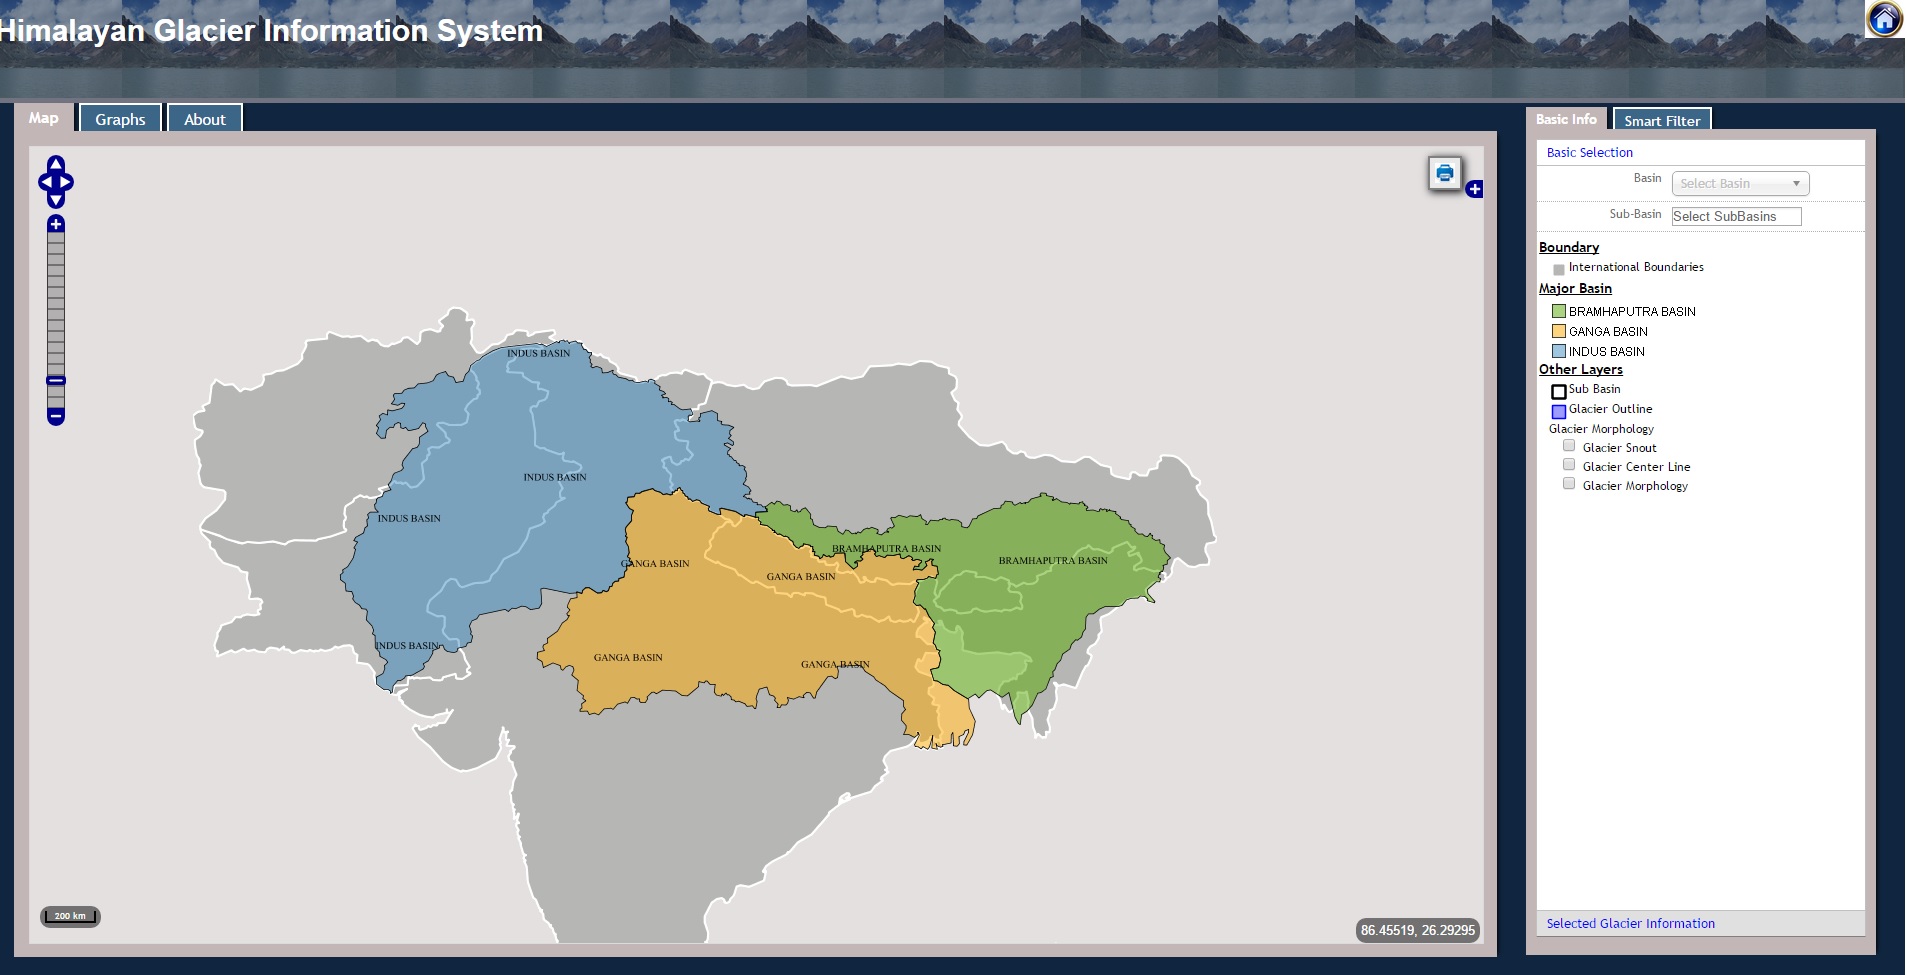
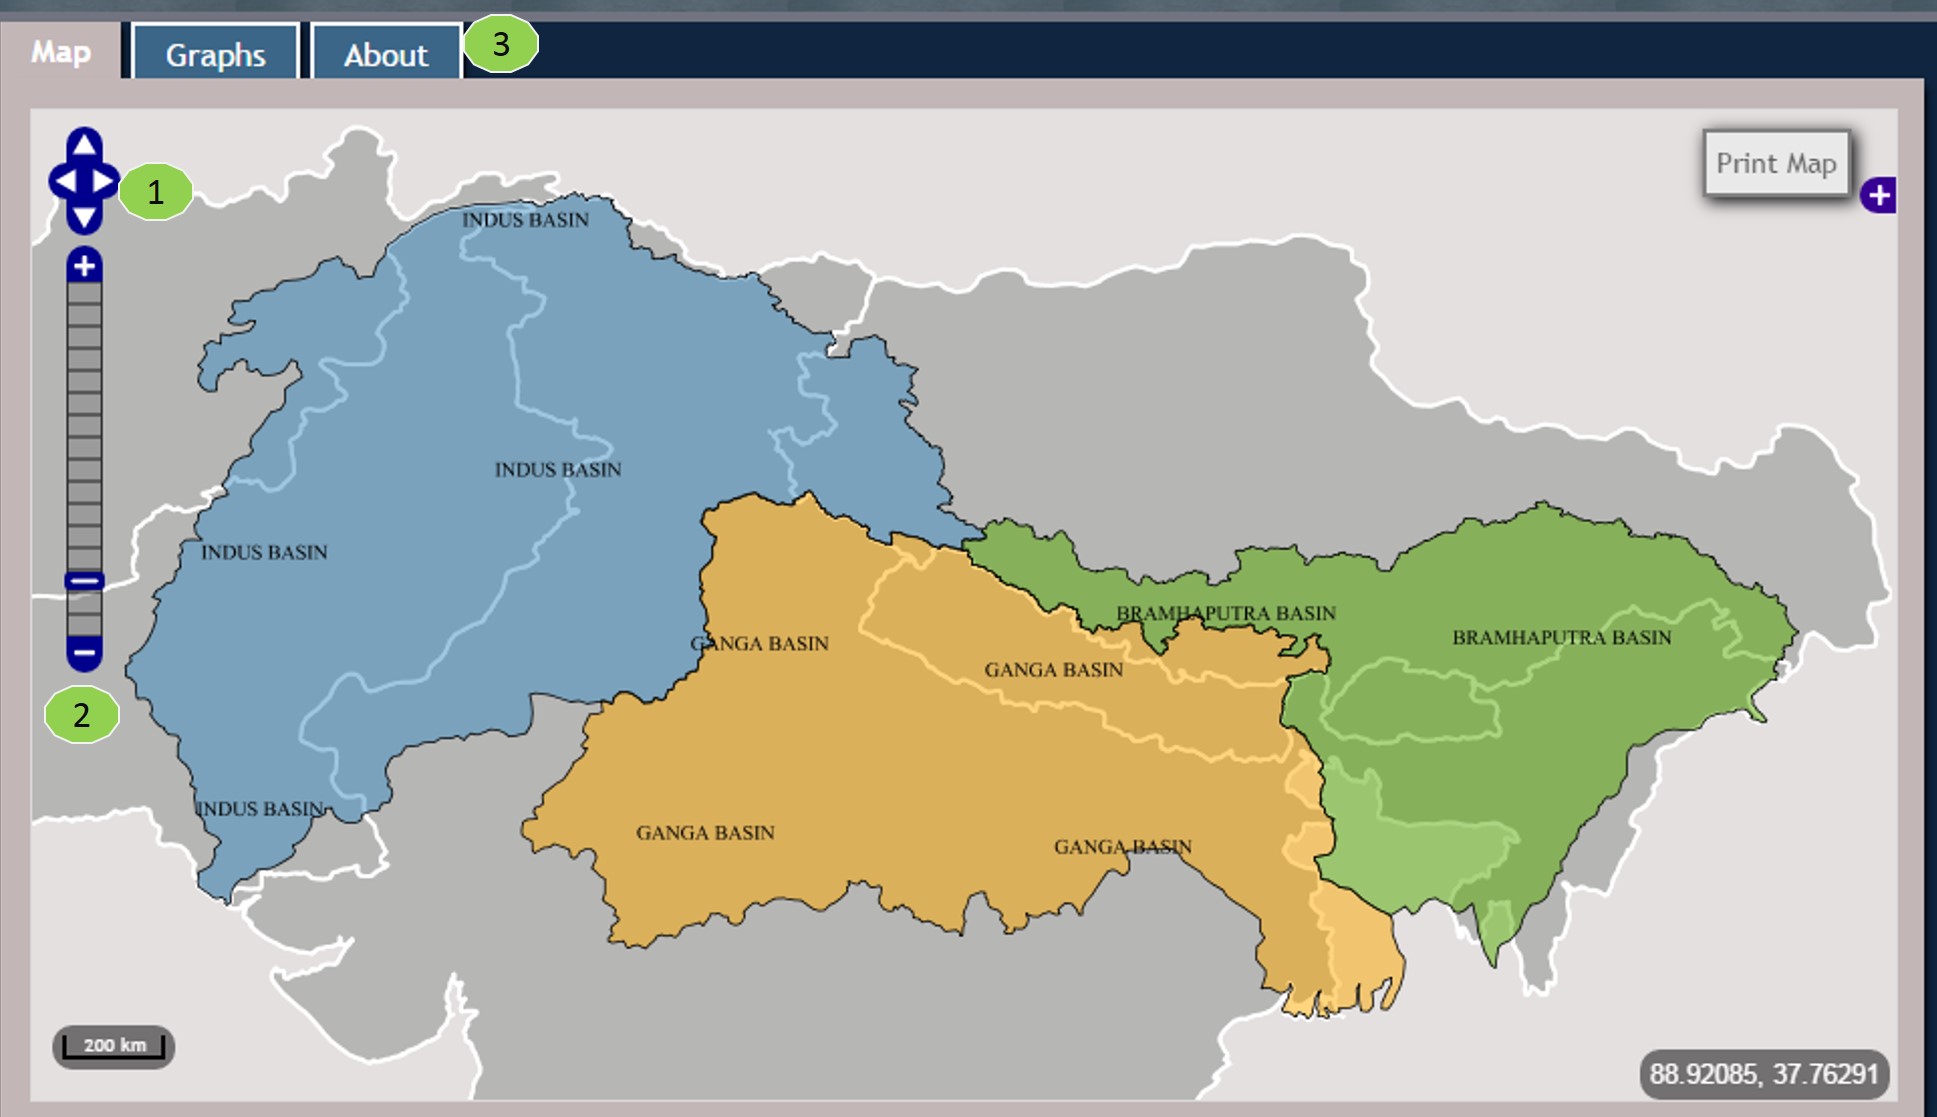
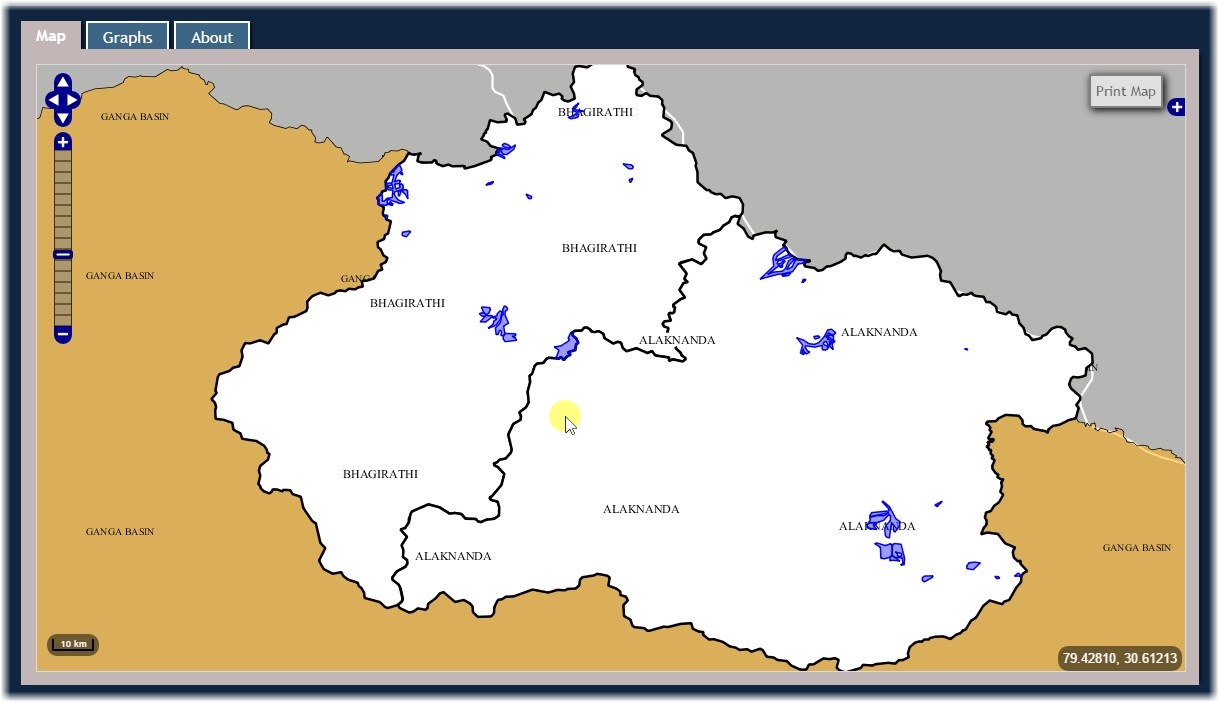
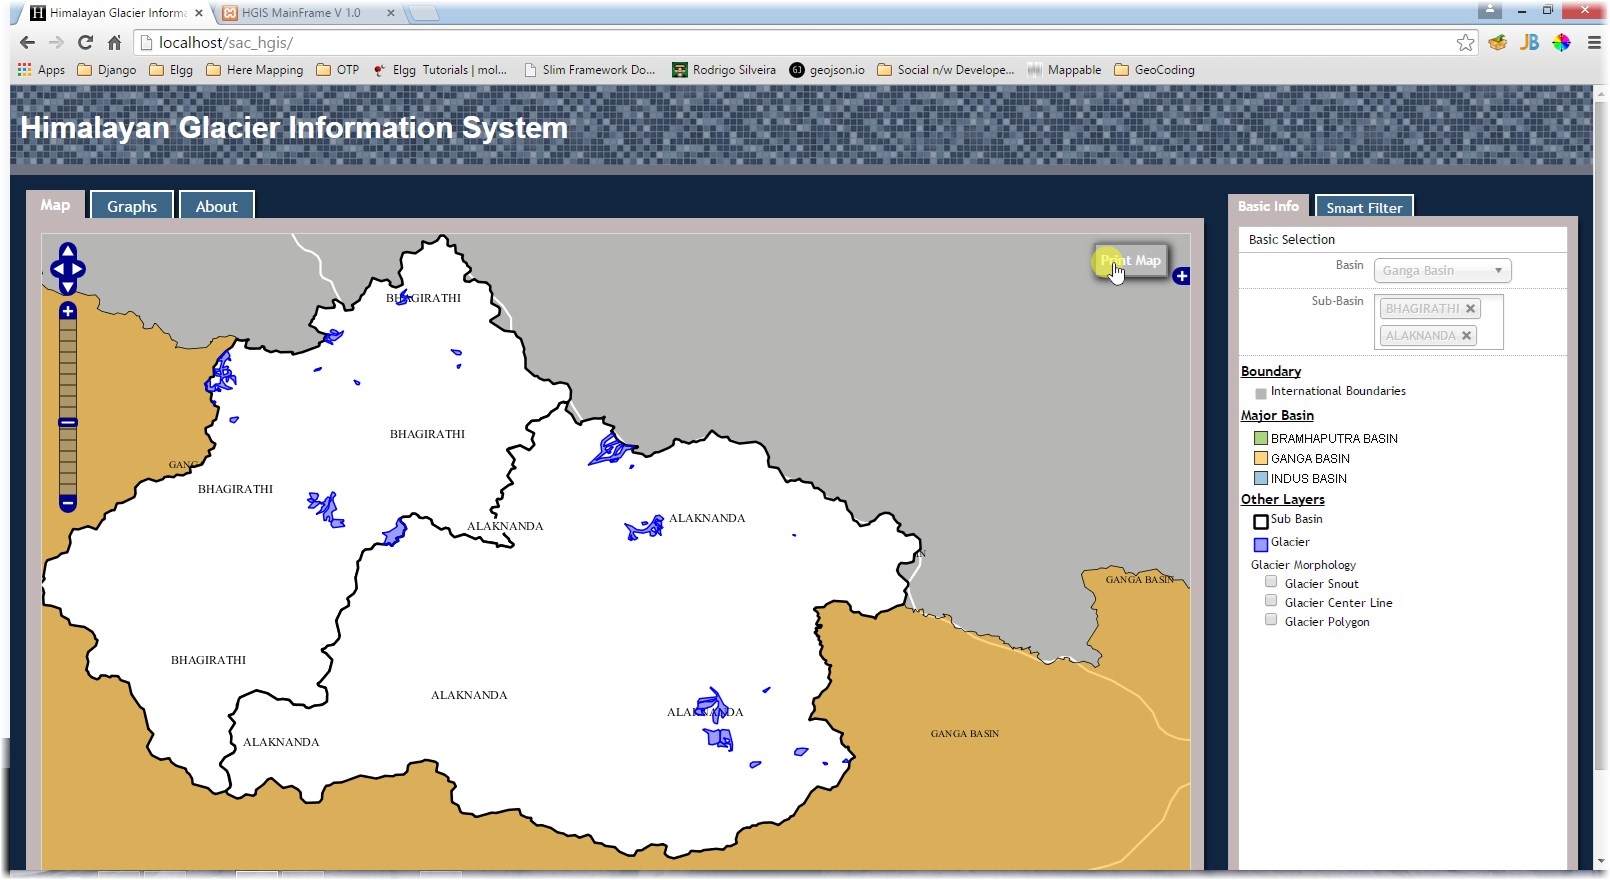
Map View provides a easiest way to visualize and interact with Himalayan Glacier.
Map Navigation
(1) Navigate : Allows user to navigate map left, right, top or bottom by clicking on a button keeping same geographic window. (2) Zoom Slide : It helps user to zoom-in / zoom-out of map the detailing.
Main Navigation
(3) Main Navigation allows user to switch between Map view and Graph view. For more information about graph view and graph creation see next section.
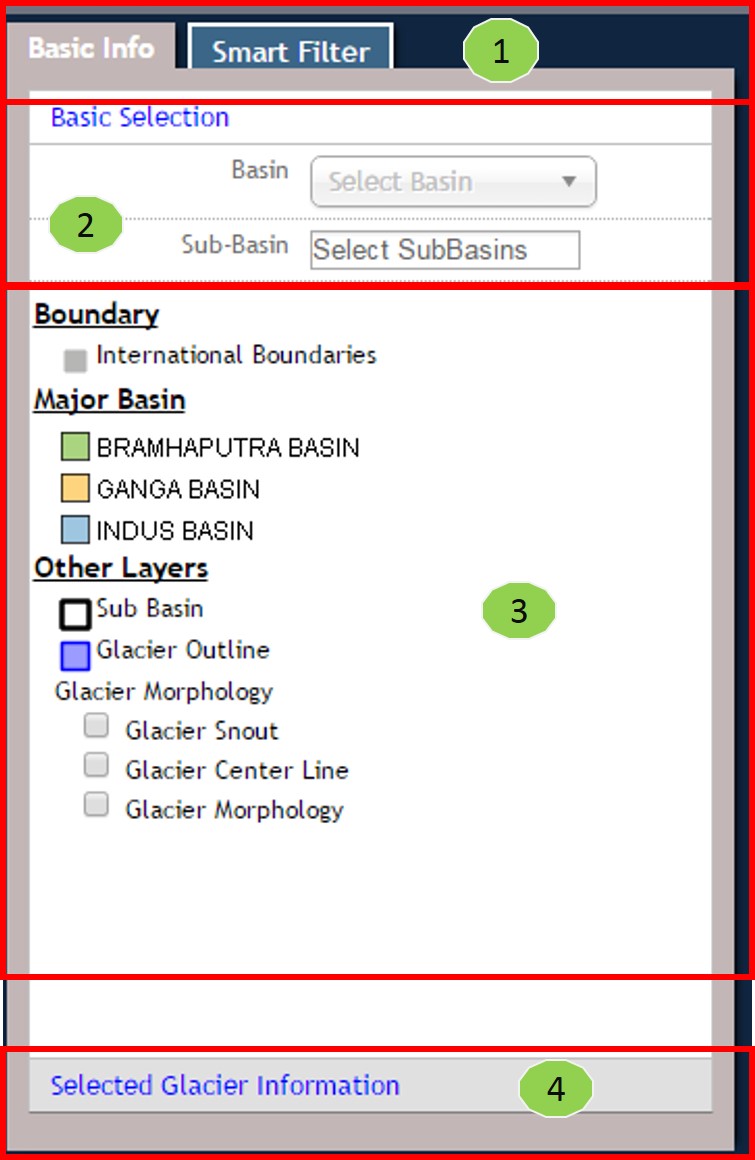
Sidebar
Sidebar provide an easy way to interact with Map view.
(1) Sidebar Navigation : Allows user to switch between basic selection section and Smart filter. for more information about smart filter, follow the tutorial.
(2) Basic Selection : Allows user to select Basin and sub-basin of selected basin. Make sure,, Basin selection is mandatory to use any other functionality of this System. Sub-basin is optional. Although for selective display and operations, Sub-basin selection is useful. It also allows user to select multiple sub-basin of selected Basin.
(3) Interactive Legend: Legend provides useful information to user, to easily identify features on map. User can interact and toggle 'Glacier Morphology' layers to see glacier specific features.
4) Glacier Information: This tab provide in-depth information about selected glacier from map. Follow this guide to see how to get Glacier information. To get Glacier information follow these steps: - Select Basin - Select Sub Basin(s) - Zoom on map to see glaciers - Click on a Glacier
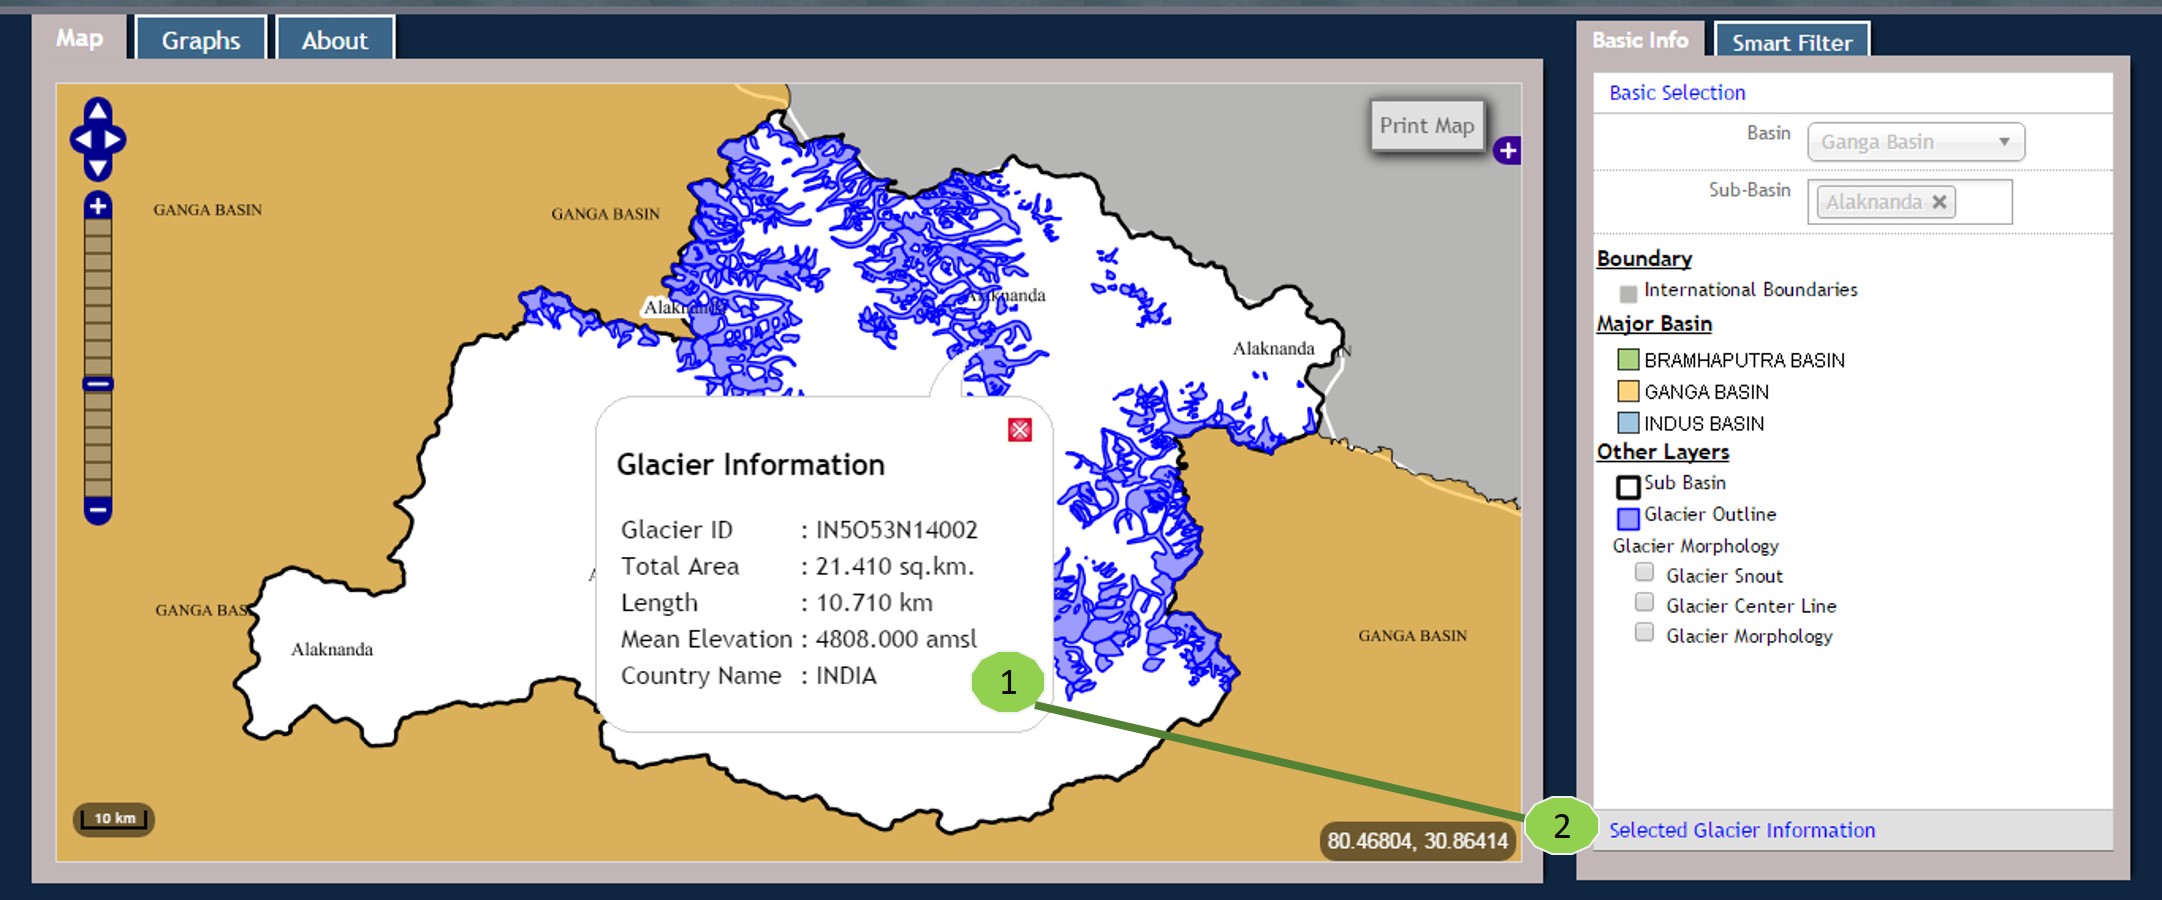
Glacier Information
To get Glacier information follow these steps: - Select Basin - Select Sub Basin(s) - Zoom on map to see glaciers - Click on a Glacier
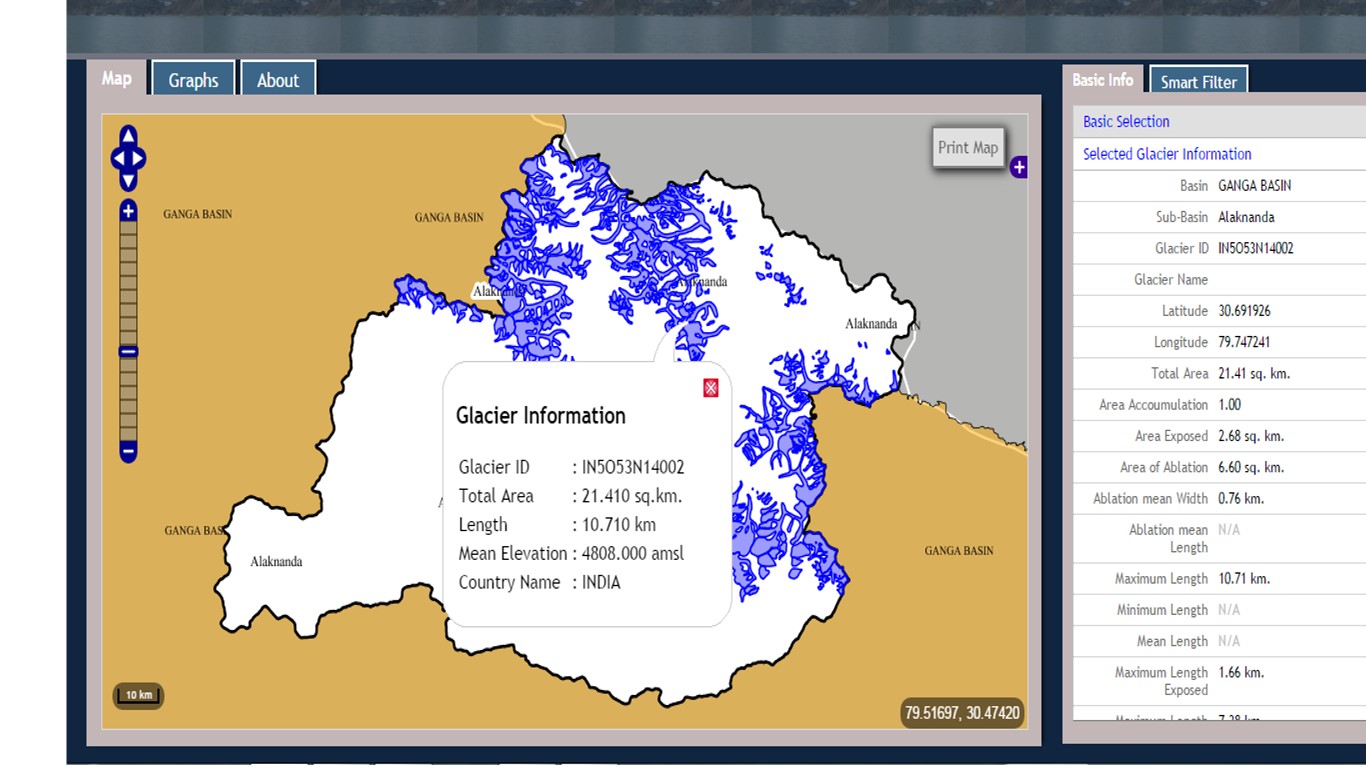
After Selection - Glacier Information
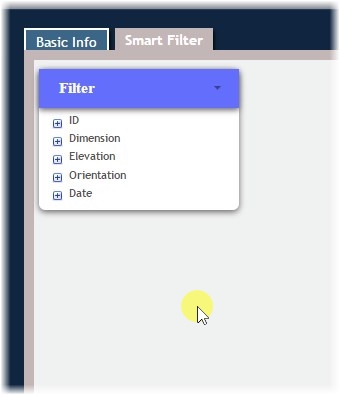
Smart Filter
Smart Filter provides an interactive and easy way to filter glaciers. To use Smart filter efficiently Follow these steps:
Smart filter creation
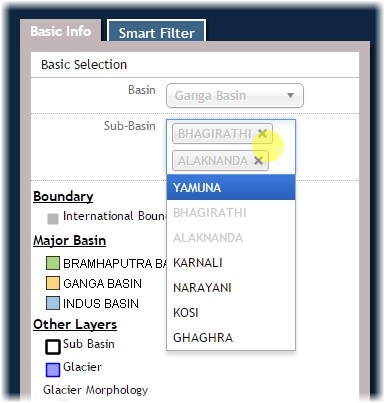
Basic Selection
1) Select Basin 2) Select Sub-basins
After selection of sub-basin(s), Map view will provide glacier-level information with basin, sub-basin and glacier following in selected sub-basin(s).
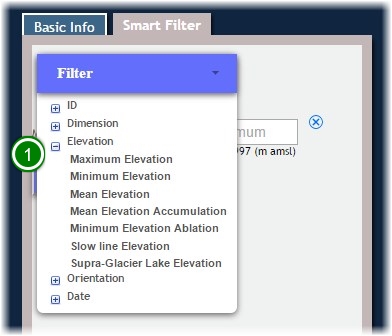
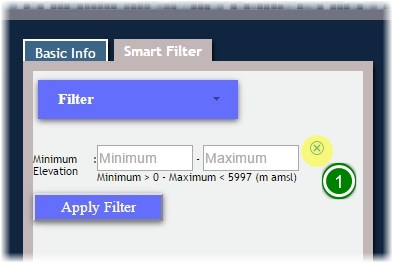
Filter Creation
To create a filter,
1) Click on [+] to expand Group of attributes. 2) Select a Attribute from the group.
Similarly user can add multiple filters of attribute to archive combine result of same.
(1) To remove specific attribute filter, click on (X) button.
On selection of attribute, it also provides useful information to user. For example, in case of Total area, user can create filter with values between 0.06 and 96.23 in form of 'Minimum > 0.06 - Maximum < 96.23 (m amsl)' bellow filter.
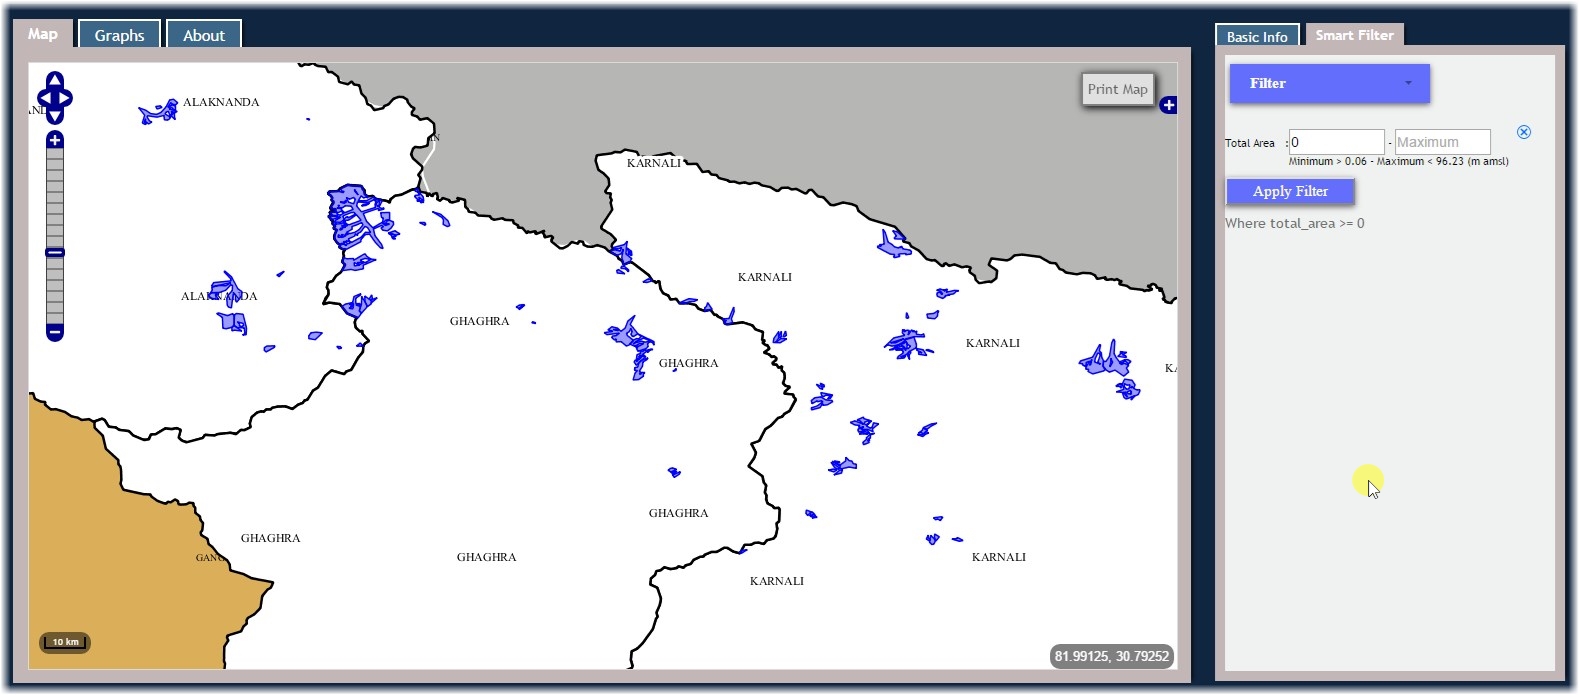
Before Applying Filter
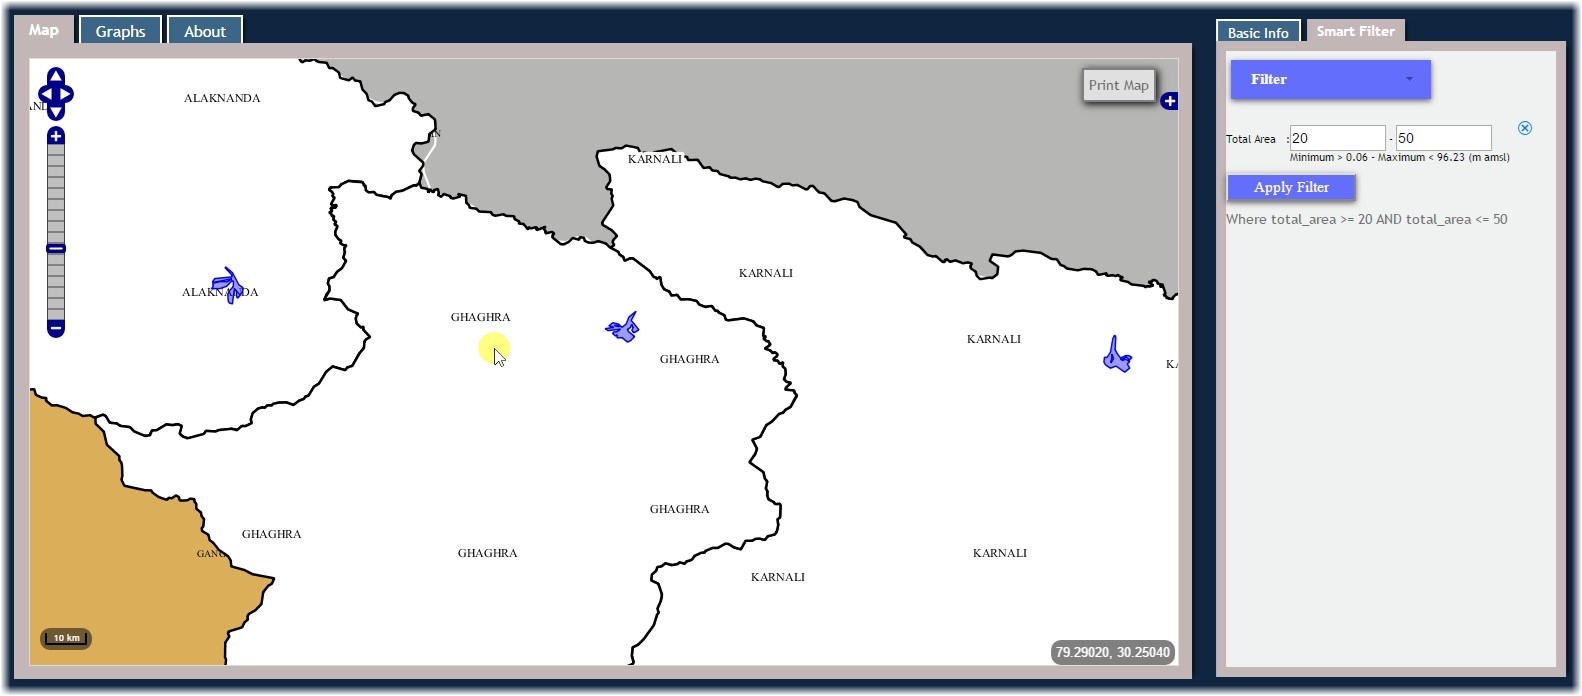
After Applying Filter
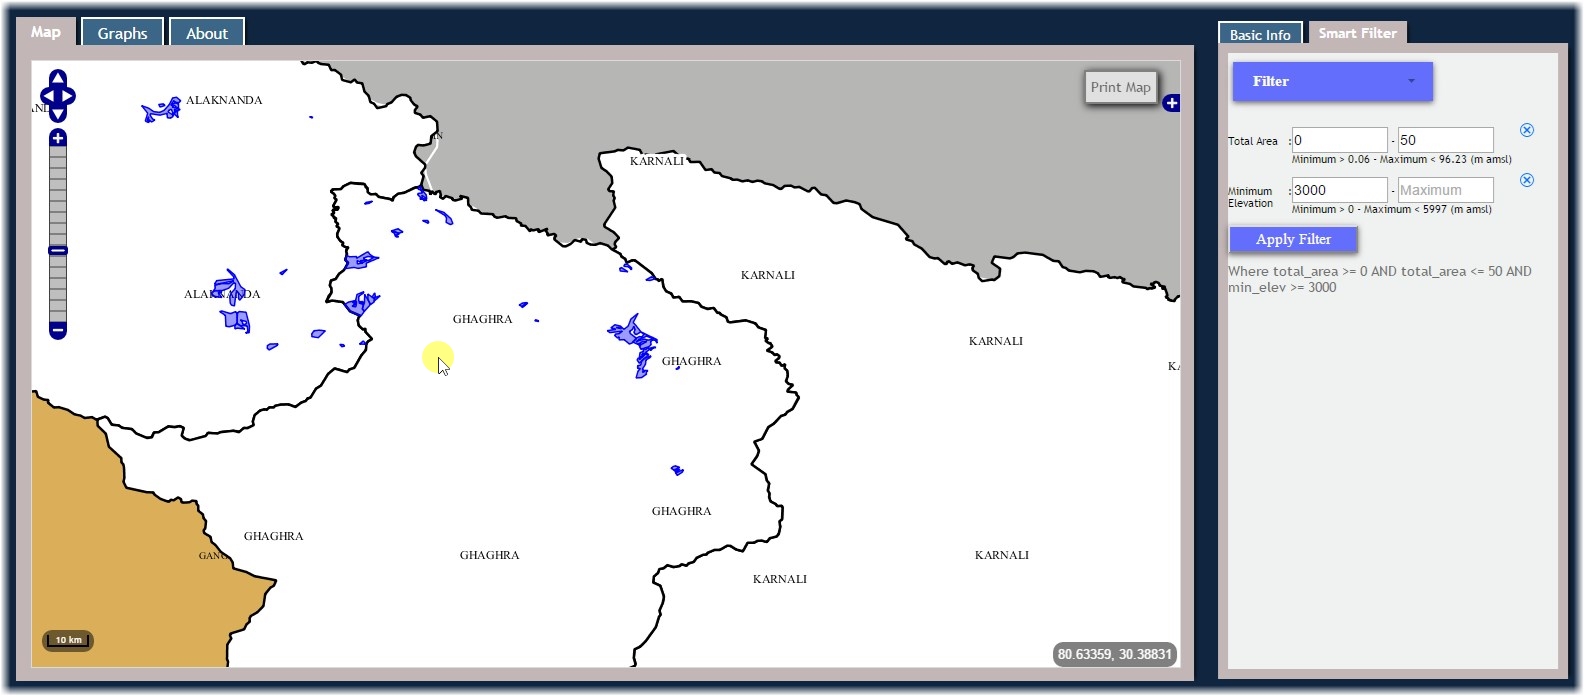
Multiple Filter Example
Statistical Analysis
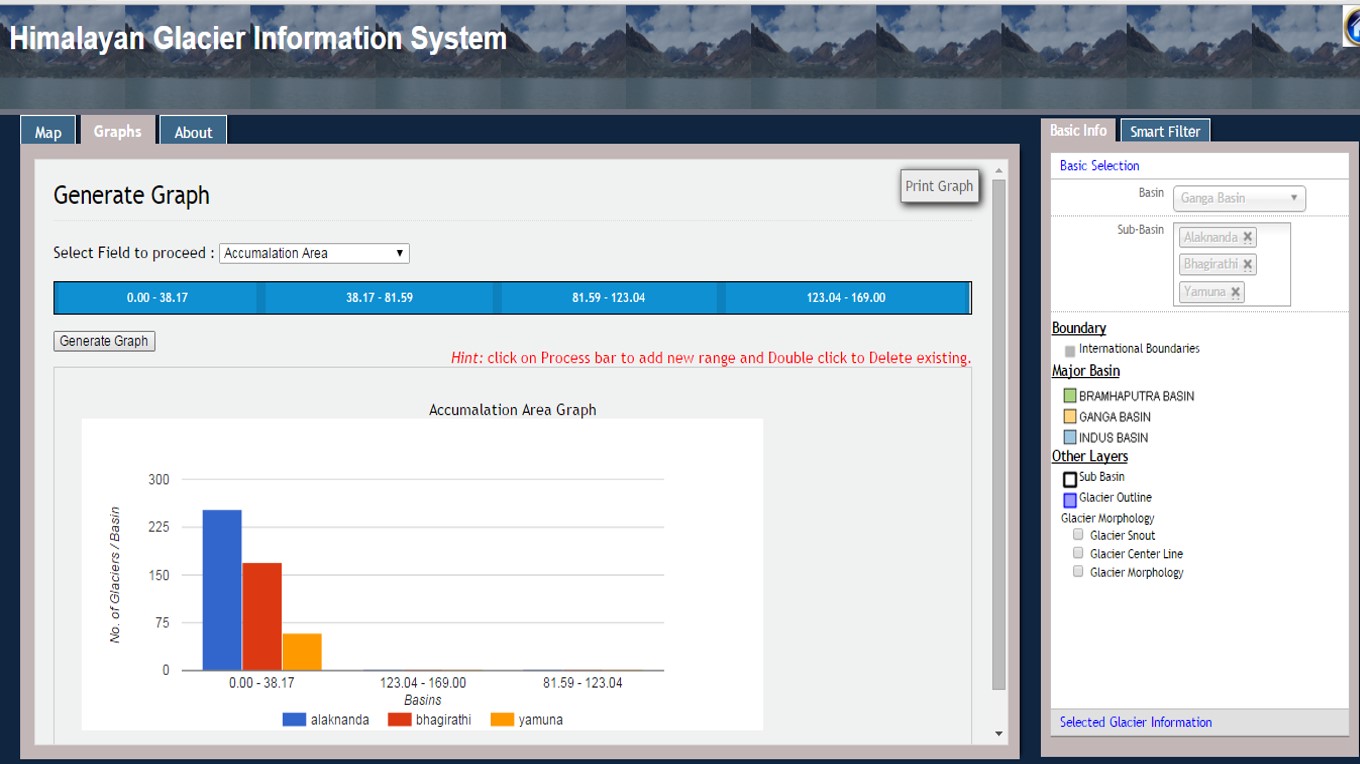
Statistical Analysis, Mainly focuses on creating Bar graphs charts to provide a visual presentation of categorical data. Categorical range can be created by user, using interactive 'Range Creator'.
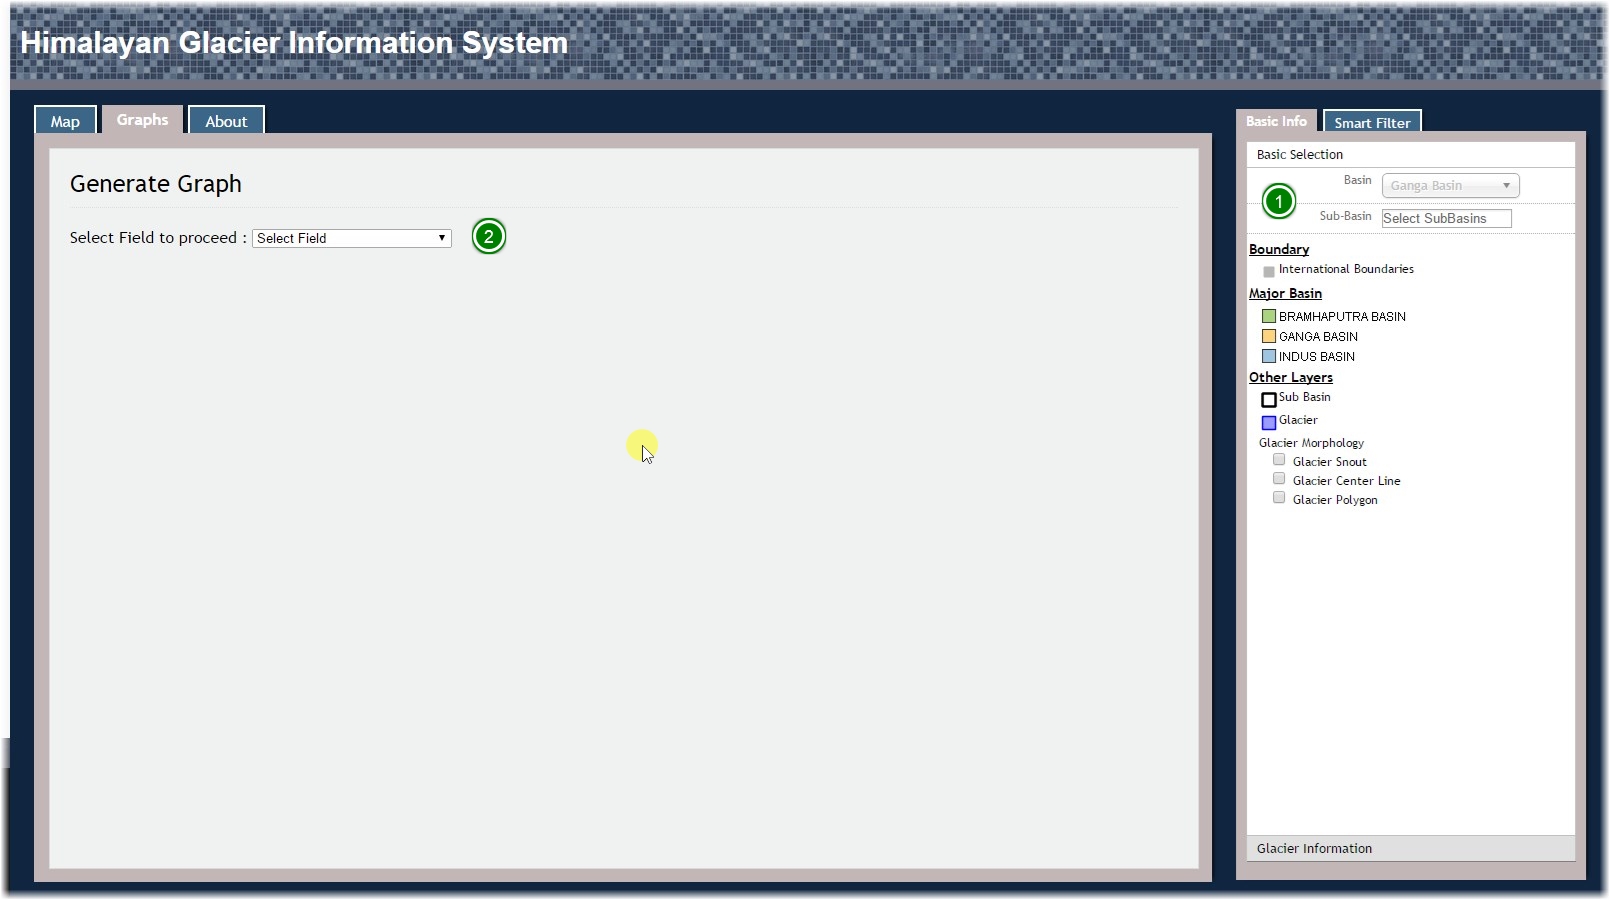
Default Section
Graph Creation
1) Before starting anything, Make sure to fulfill 1st step of selecting Basin and sub-basin (optional).
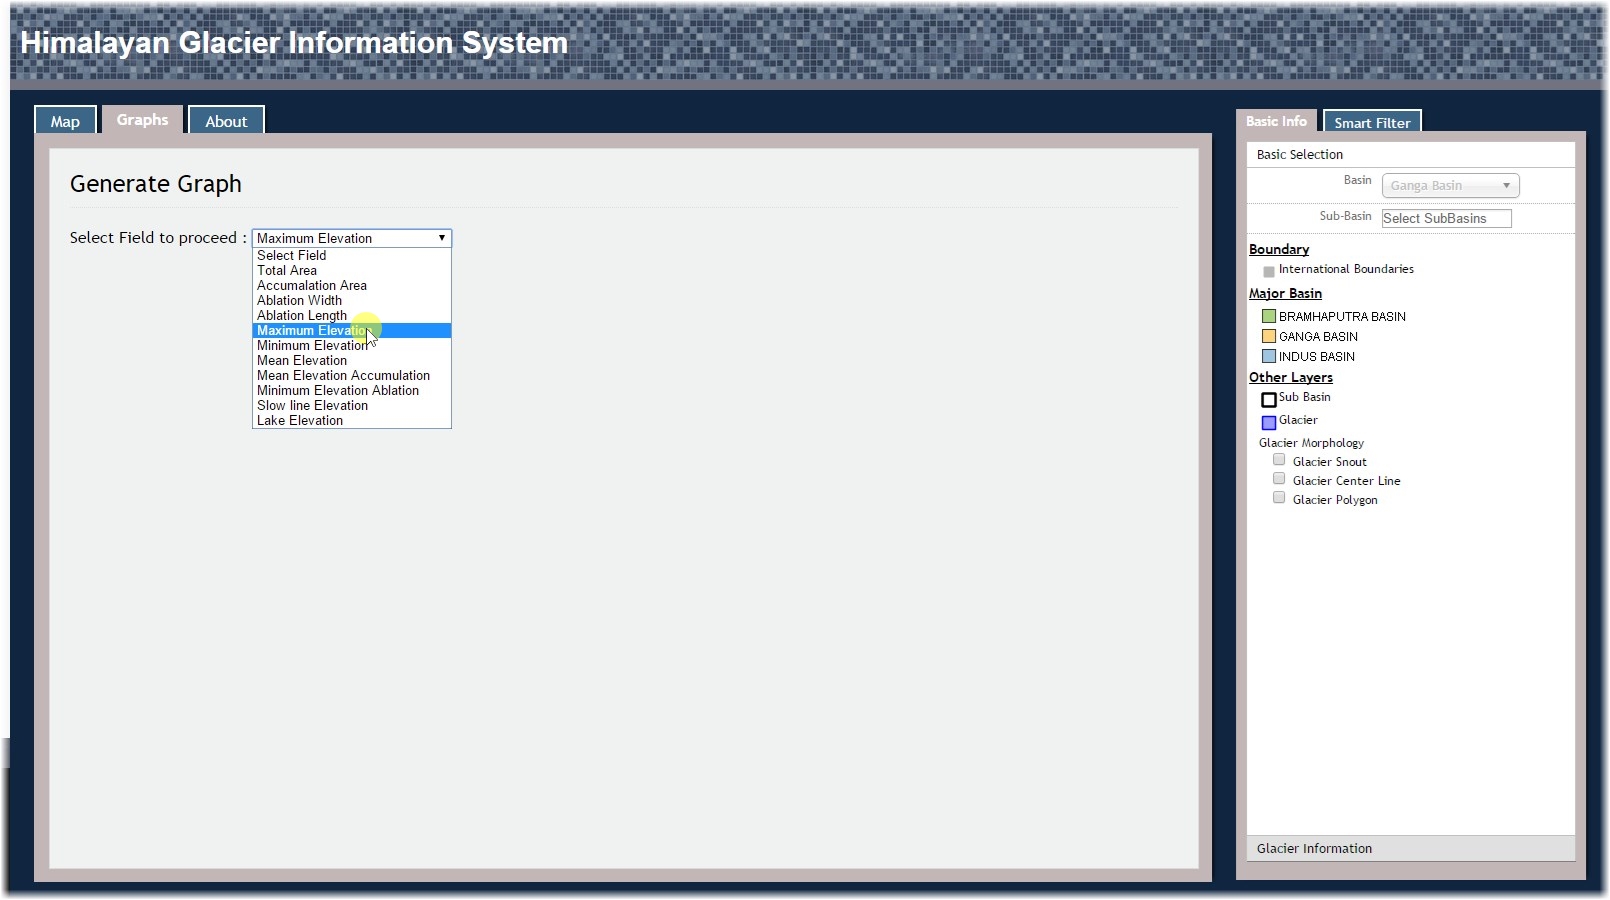
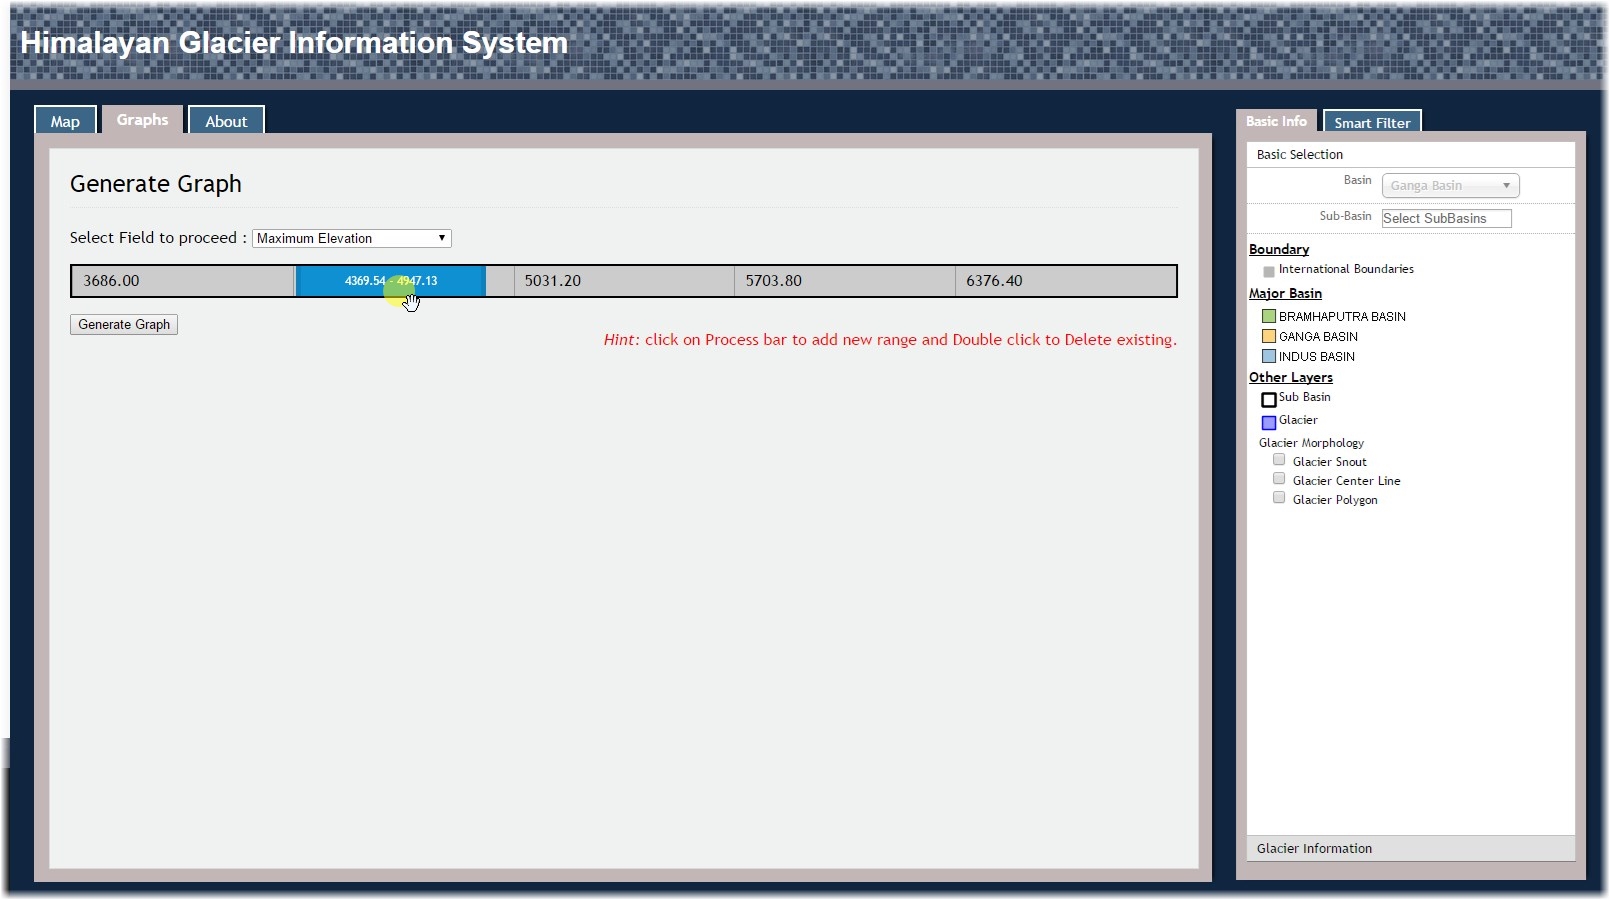
Select a Attribute from Dropdown
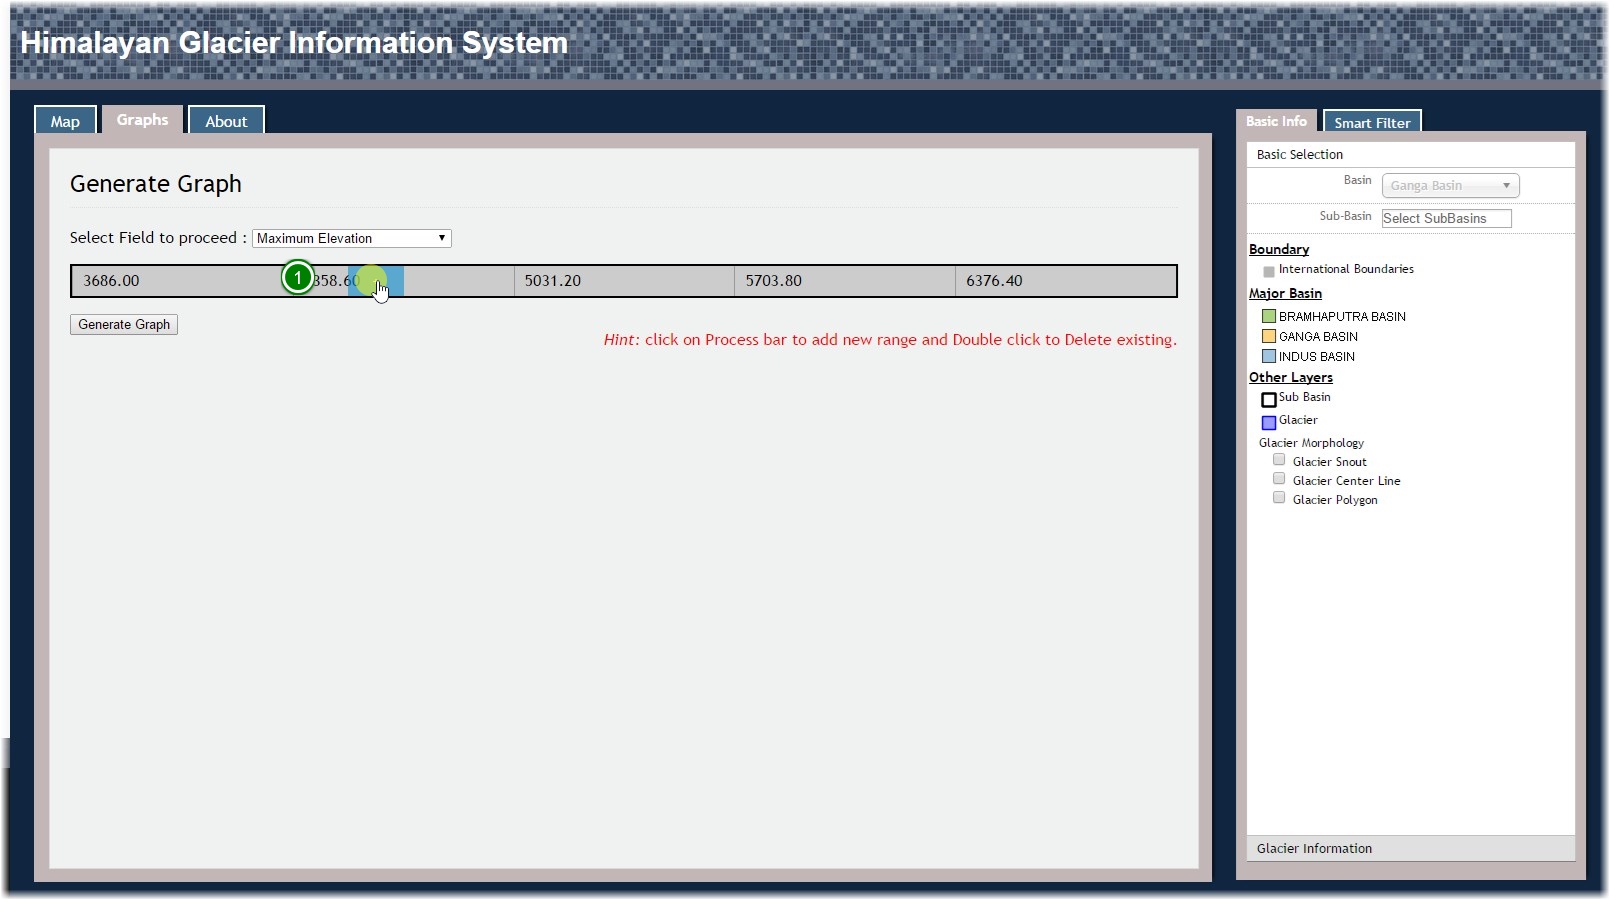
Create Range using Interactive range creator
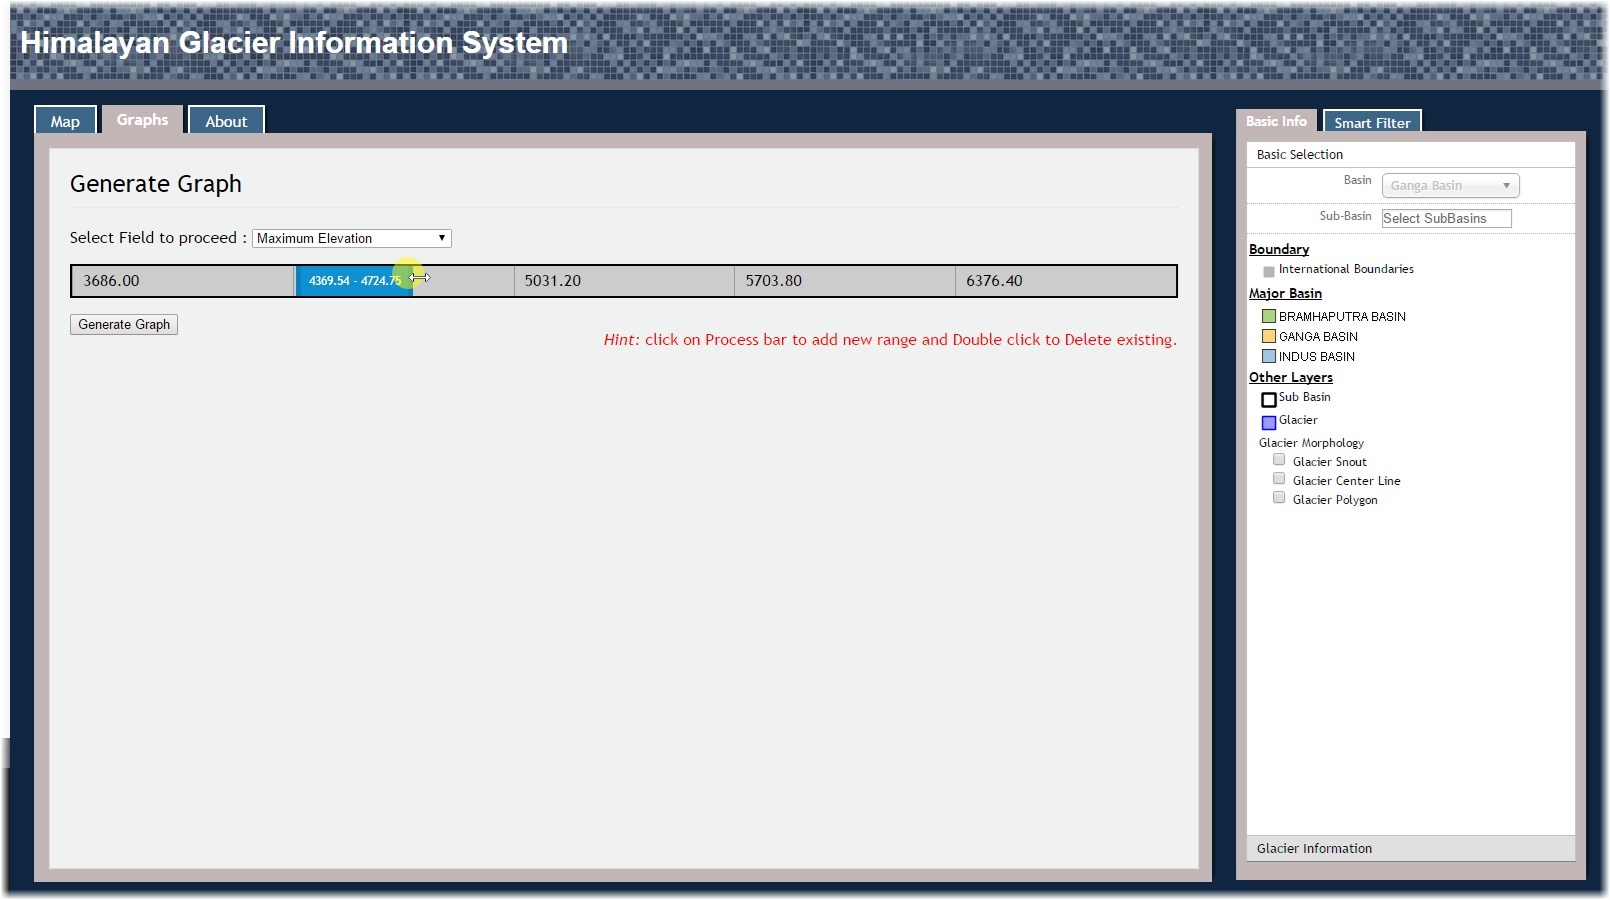
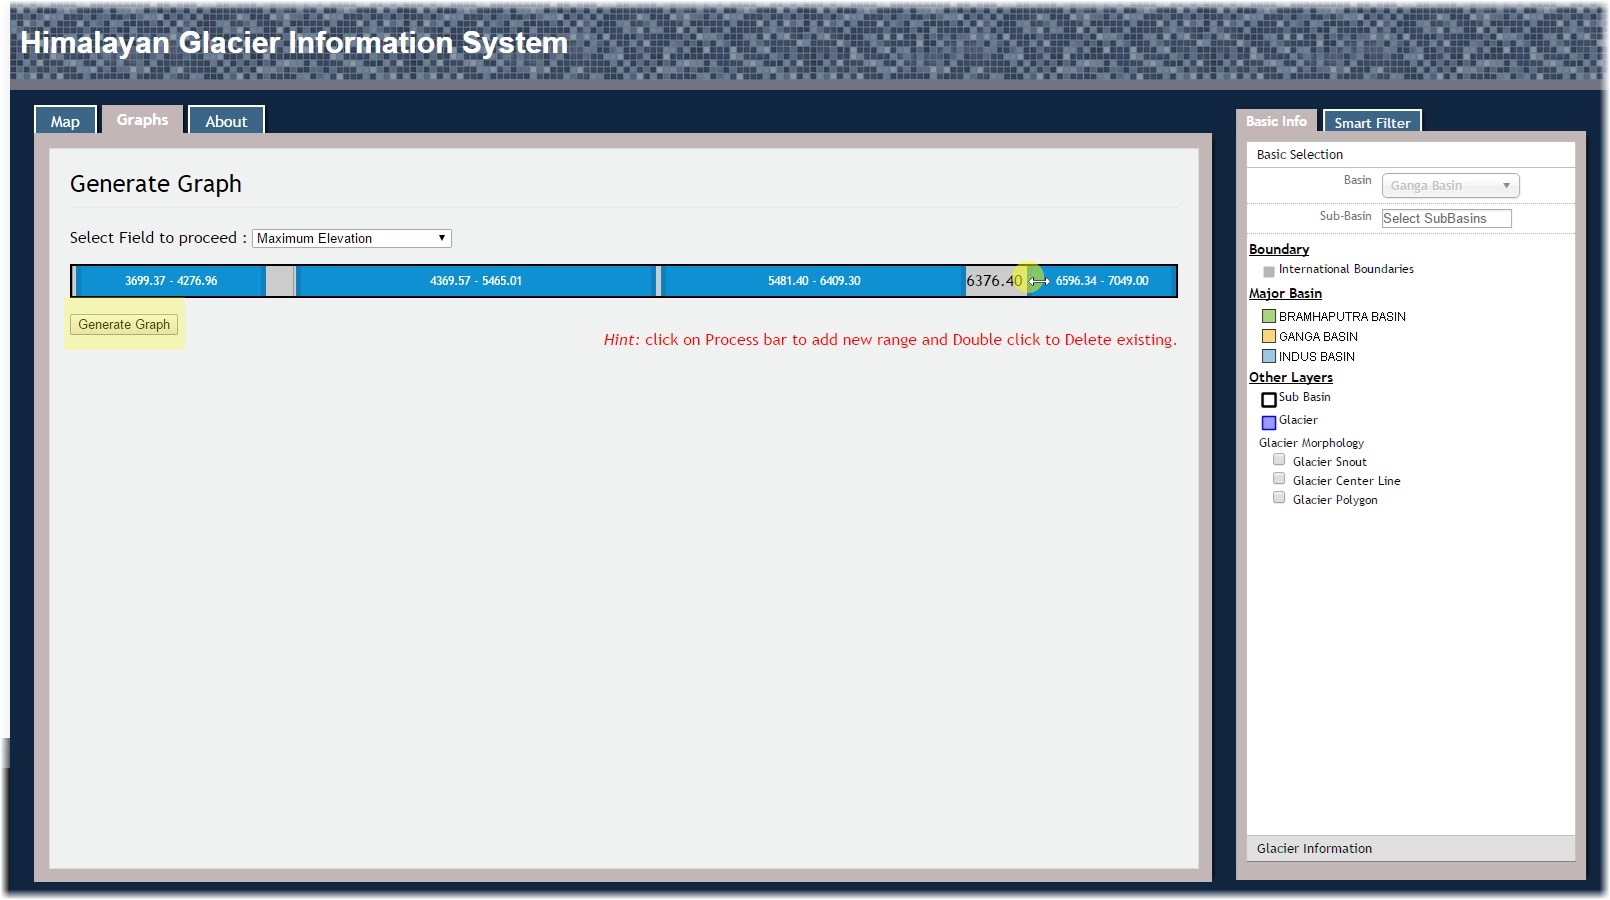
1) Click on Range Bar to create new Range. 2) Drag side of newly created range to increase / decrease range, as shown below.
3) Move Range by holding from middle of the range.
Similarly, user can Create Multiple Range.
Create Multiple Ranges
**Double click on to Delete a existing range.
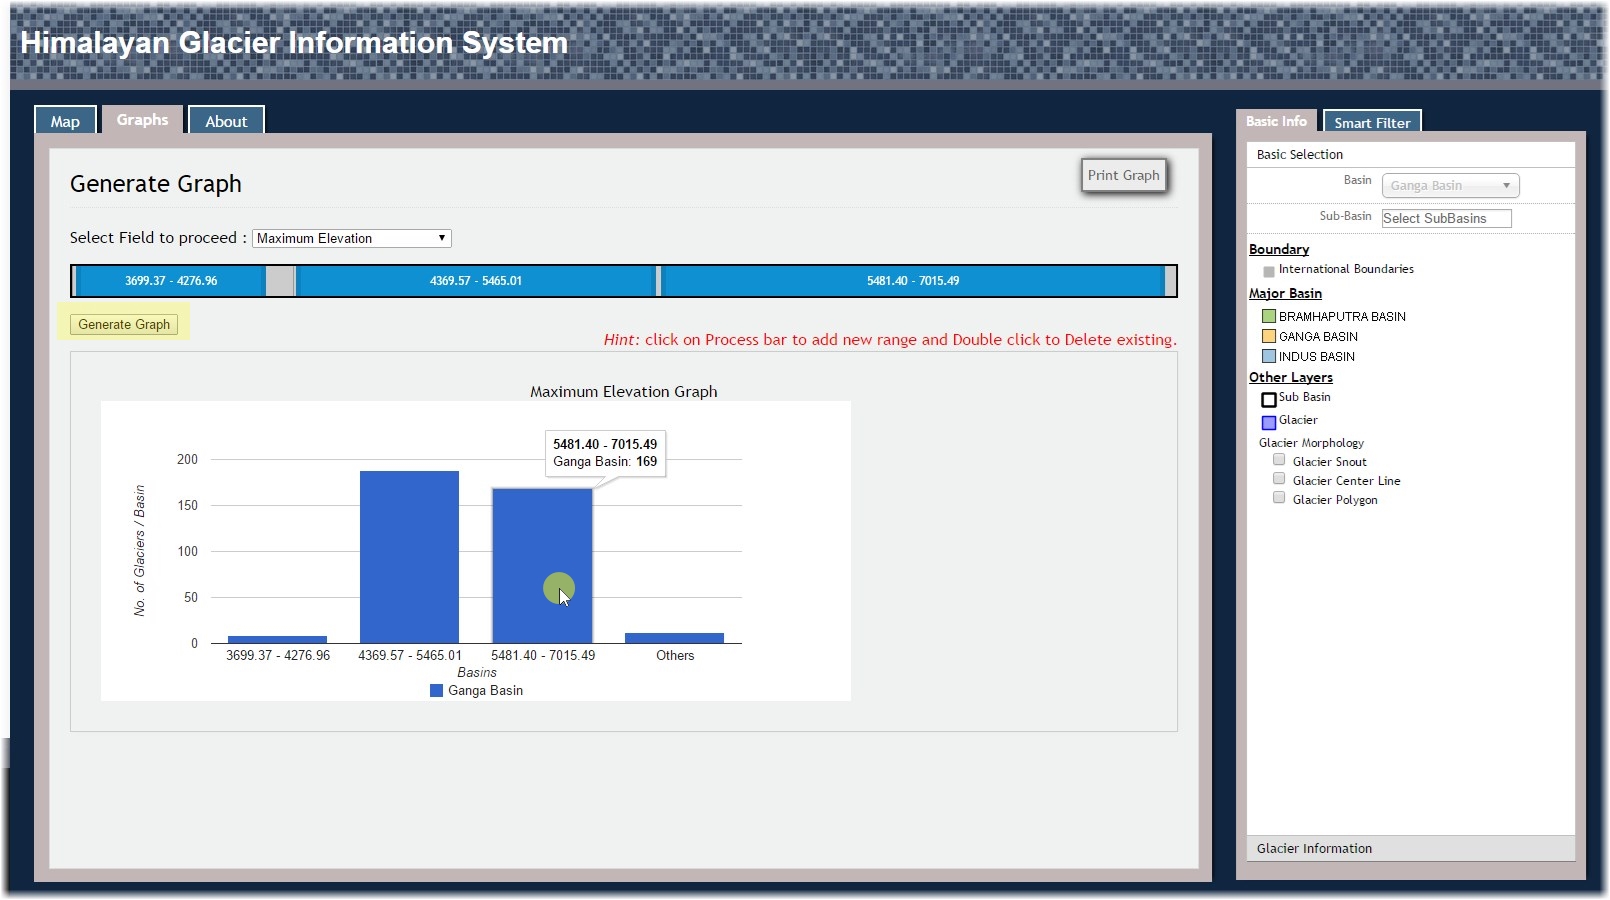
Generate Bar Graph
After Creating ranges using 'Interactive range creator', click on 'Generate Graph' button to create bar graph.
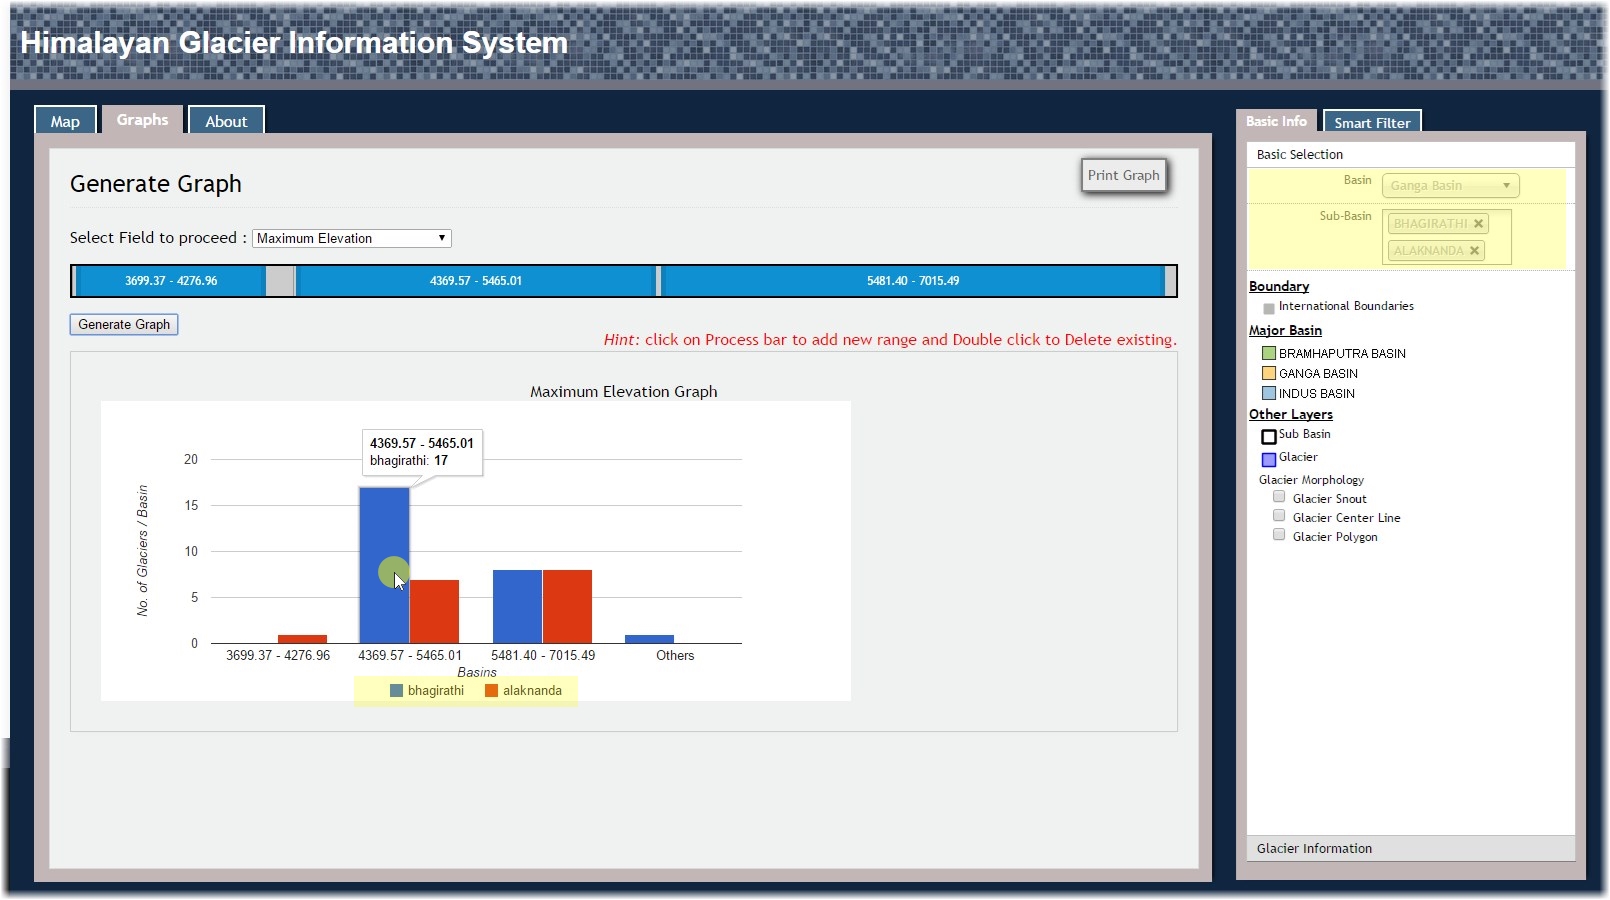
Sub-Basin level Graph
To Create Sub-basin specific graph, select sub-basin(s) from sidebar.
Export Map
Follow 'Quick Overview' tutorial from HGIS system for how to interact with Map and Map view.
Export Map
After Zooming in to desired area, click on 'Print Map' button at right-top side of map.
Print Map
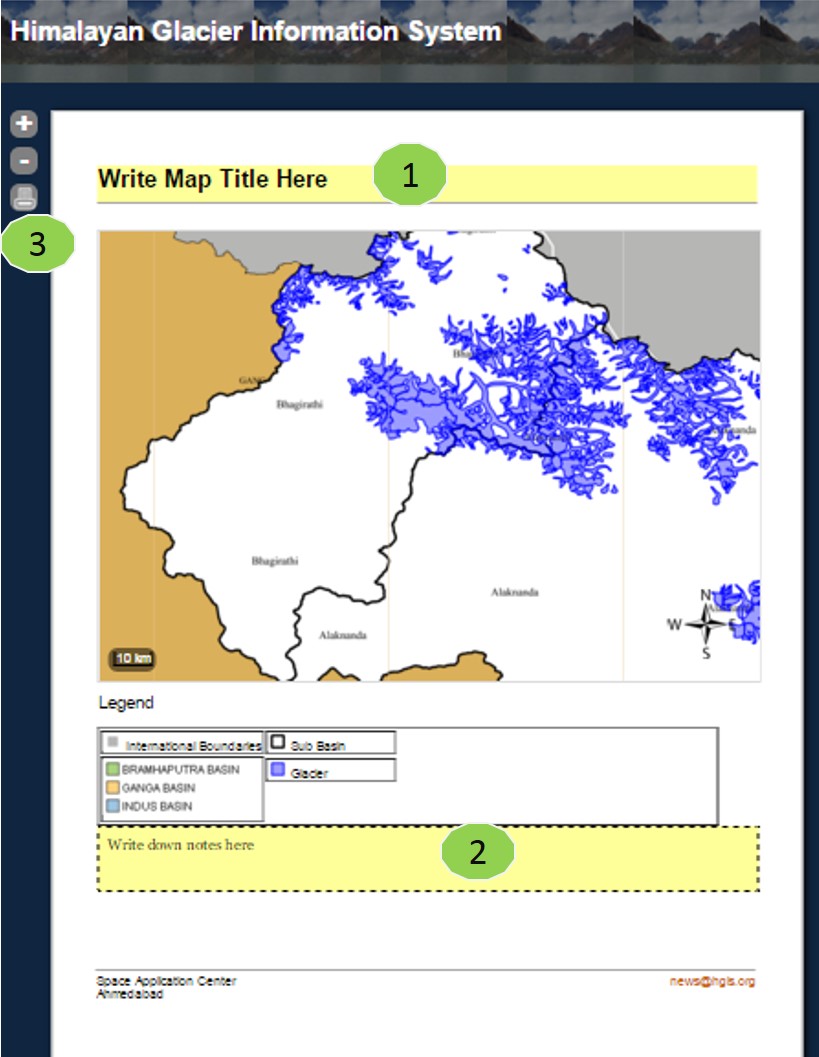
HGIS Exporter allows user to edit content of page before printing the map. Editable areas are:
(1) Title of the page. (2) Content of the page.
After editing content, click on print (3) to print the map.
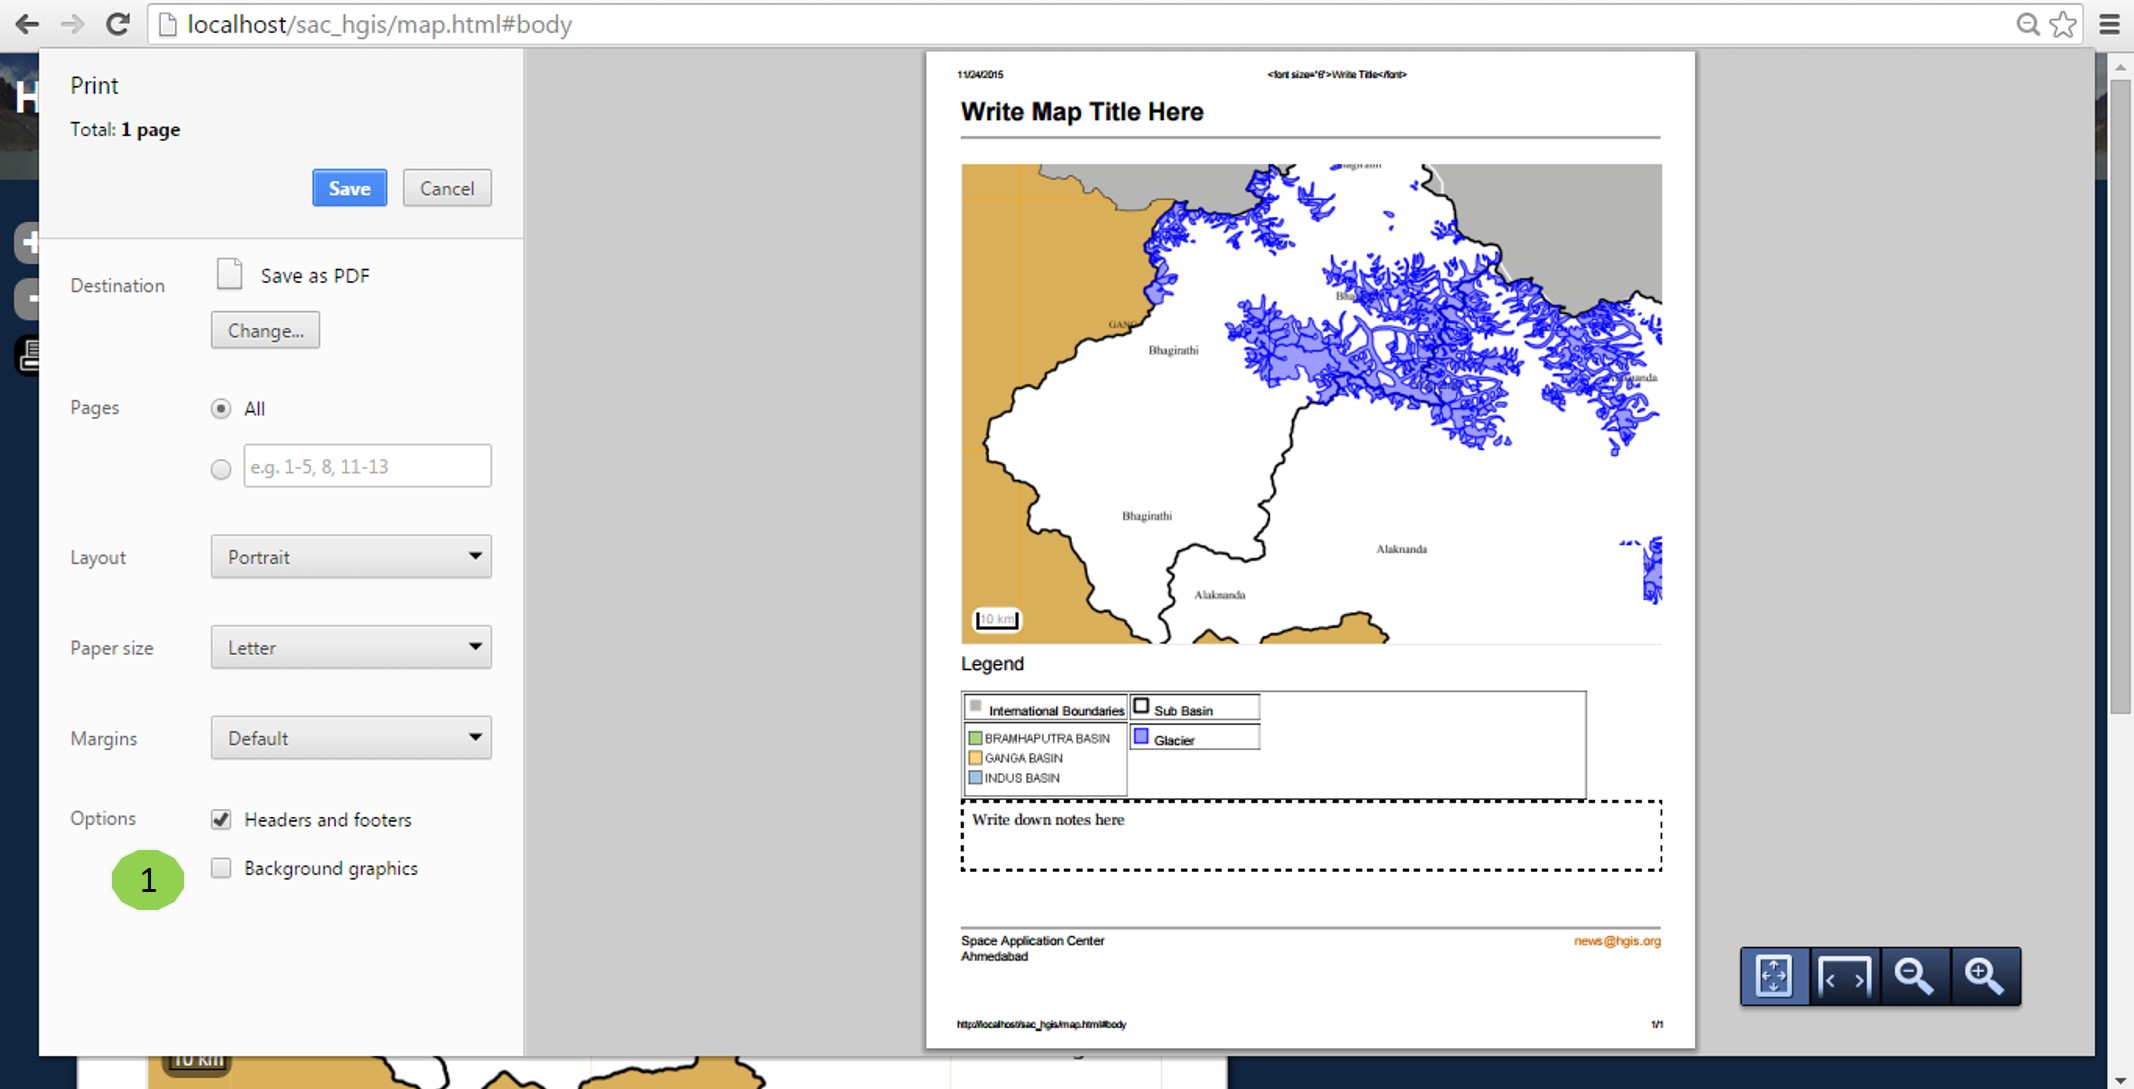
Print Map
To have best results, make sure to enable 'background graphics' of the printer.
Export Graph
Follow 'Statistical Analysis' tutorial from HGIS system to create graph for Basin / Sub-basins(s).
Export Graph
After Creating Graph for desired Basin / sub-basin(s), click on 'Print Graph' button at right-top side.
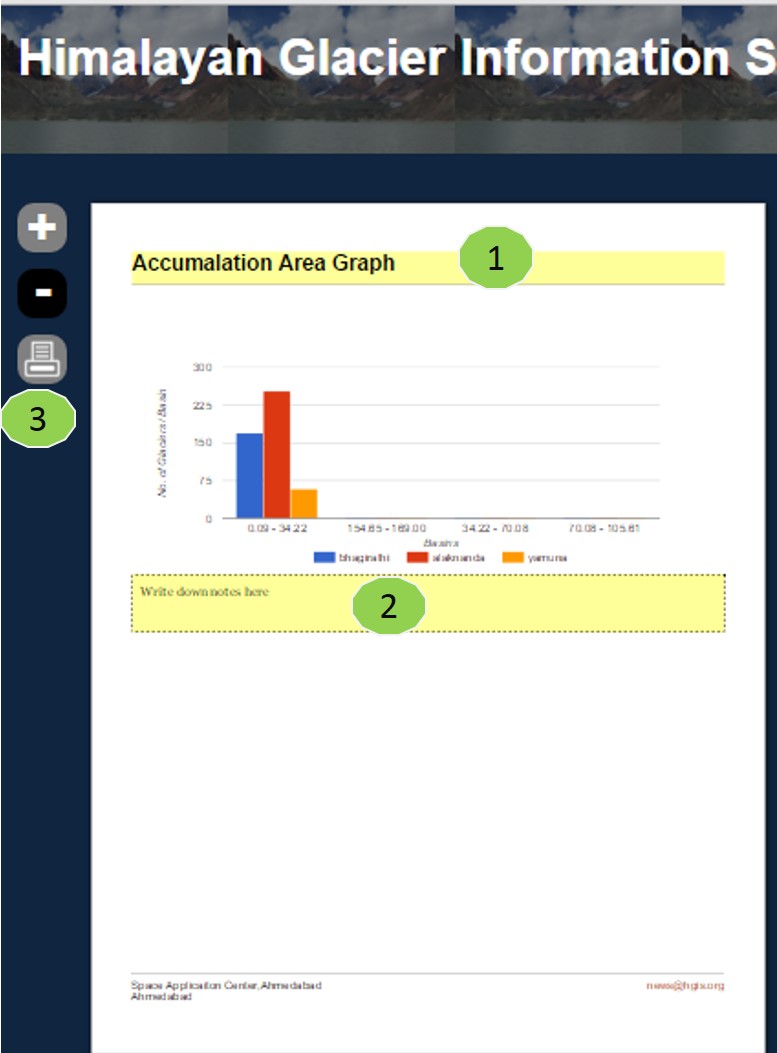
HGIS Exporter allows user to edit content of page before printing the Graph. Editable areas are:
(1) Title of the page. (2) Content of the page.
After editing content, click on print (3) to print the Graph.
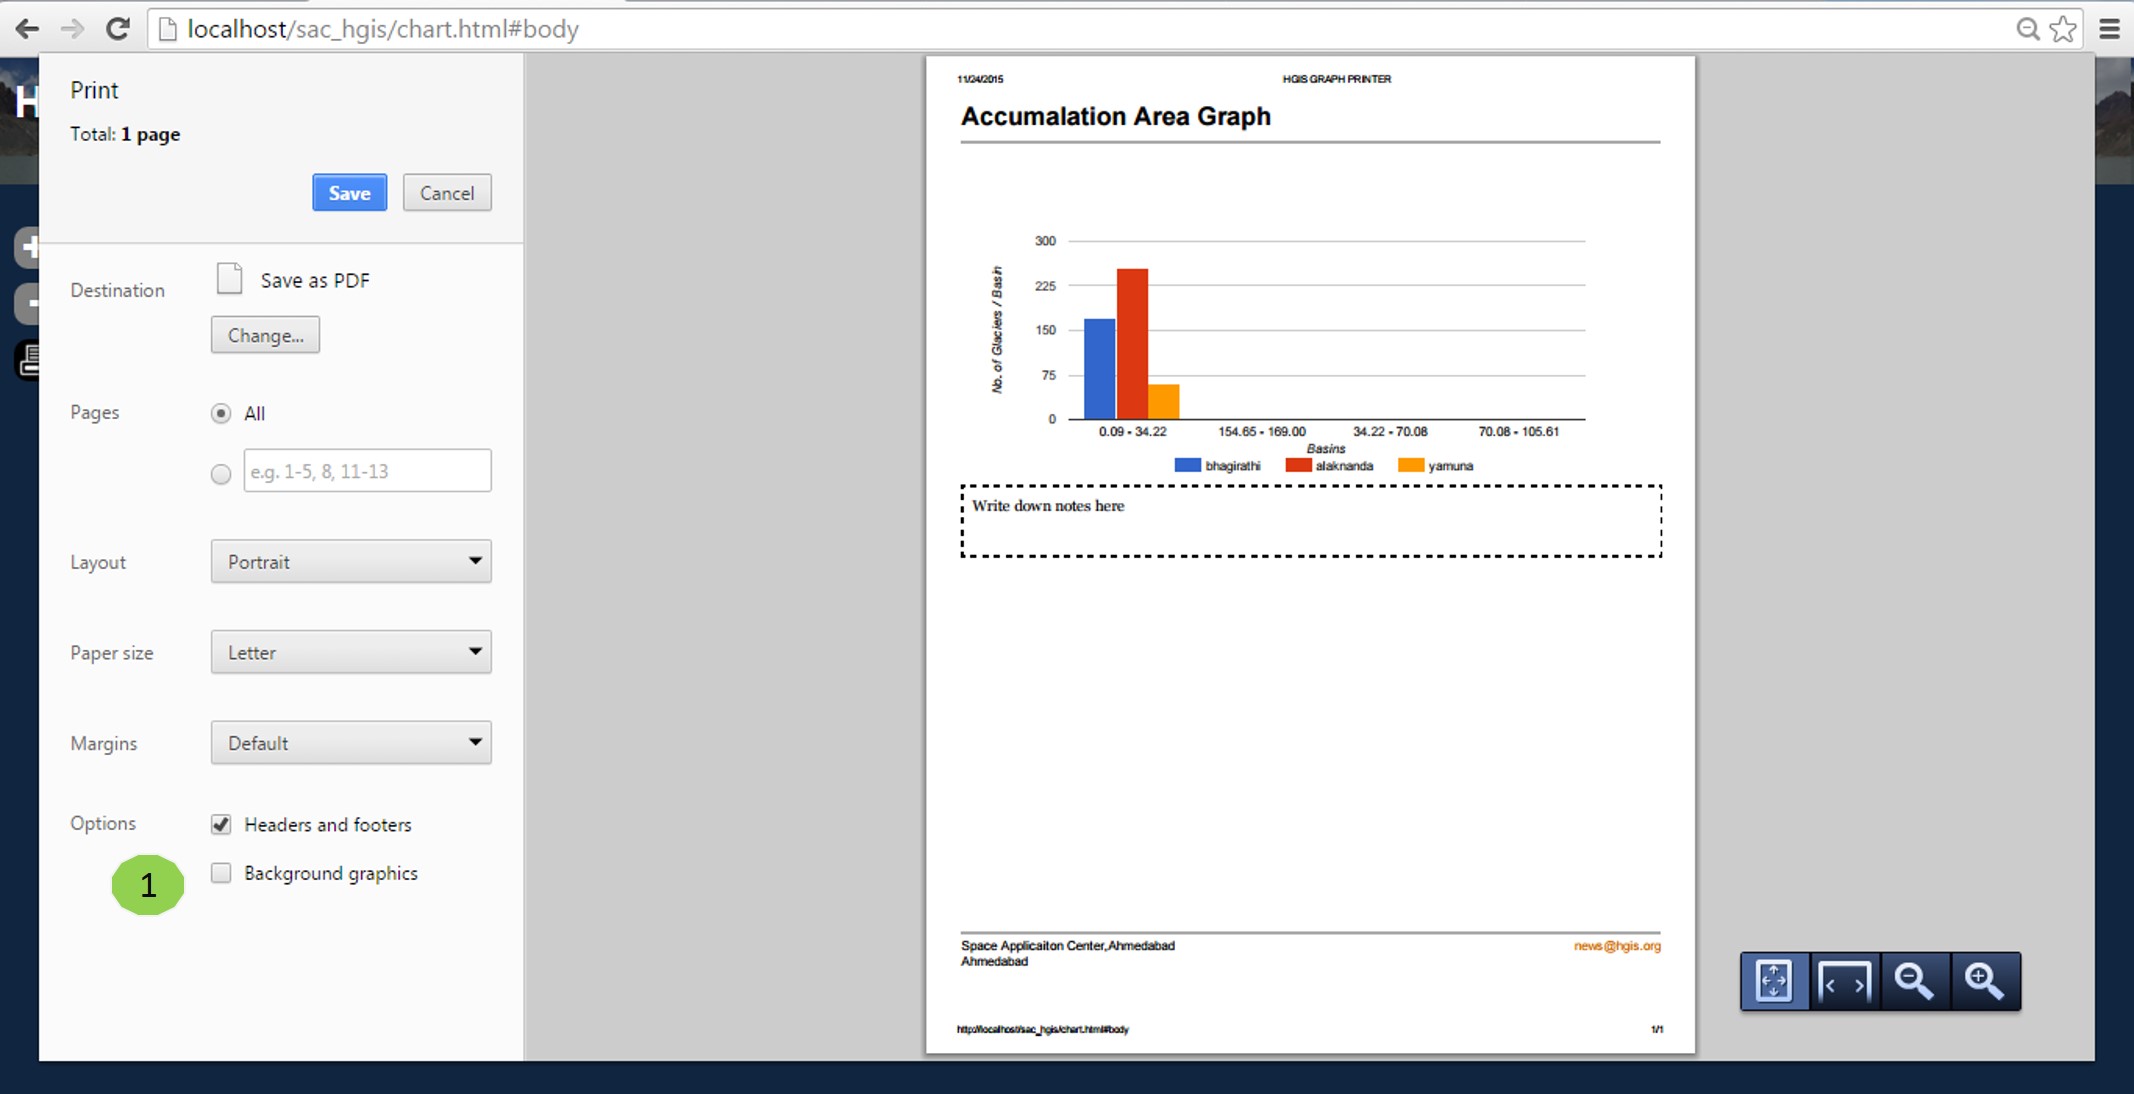
Print Graph
To have best results, make sure to enable 'background graphics' of the printer.