- Reference Layers
- Data & Analysis
- Tools and Charts
-
Reference Layers :
As seen in the Figure 1, Referance layers tab include four sub tabs Administrative, Infrastructure, Imagery and Others. Administrative Layers contains Cities/Towns, Administrative boundaries, Administrative Boundary from Bhuvan and base maps from MapMyIndia. Infrastructure tab contains National Highways, Railway tracks /stations and airports. Imagery tab contains High Resolution satellite imagery from Bhuvan and other images including Cartosat-I, Mosaic (2.5m), RISAT Mosaic (18m), LISS-III Mosaic (24m), AWiFS Mosaic (56m), INSAT-Visible (1km) and INSAT-Thermal IR (4km). Others tab contains Open Street Map (OSM), Digital Elevation Model (DEM), Survey of India (SOI) Grid at 1 degree and 15 minutes interval and Rivers/Streams .
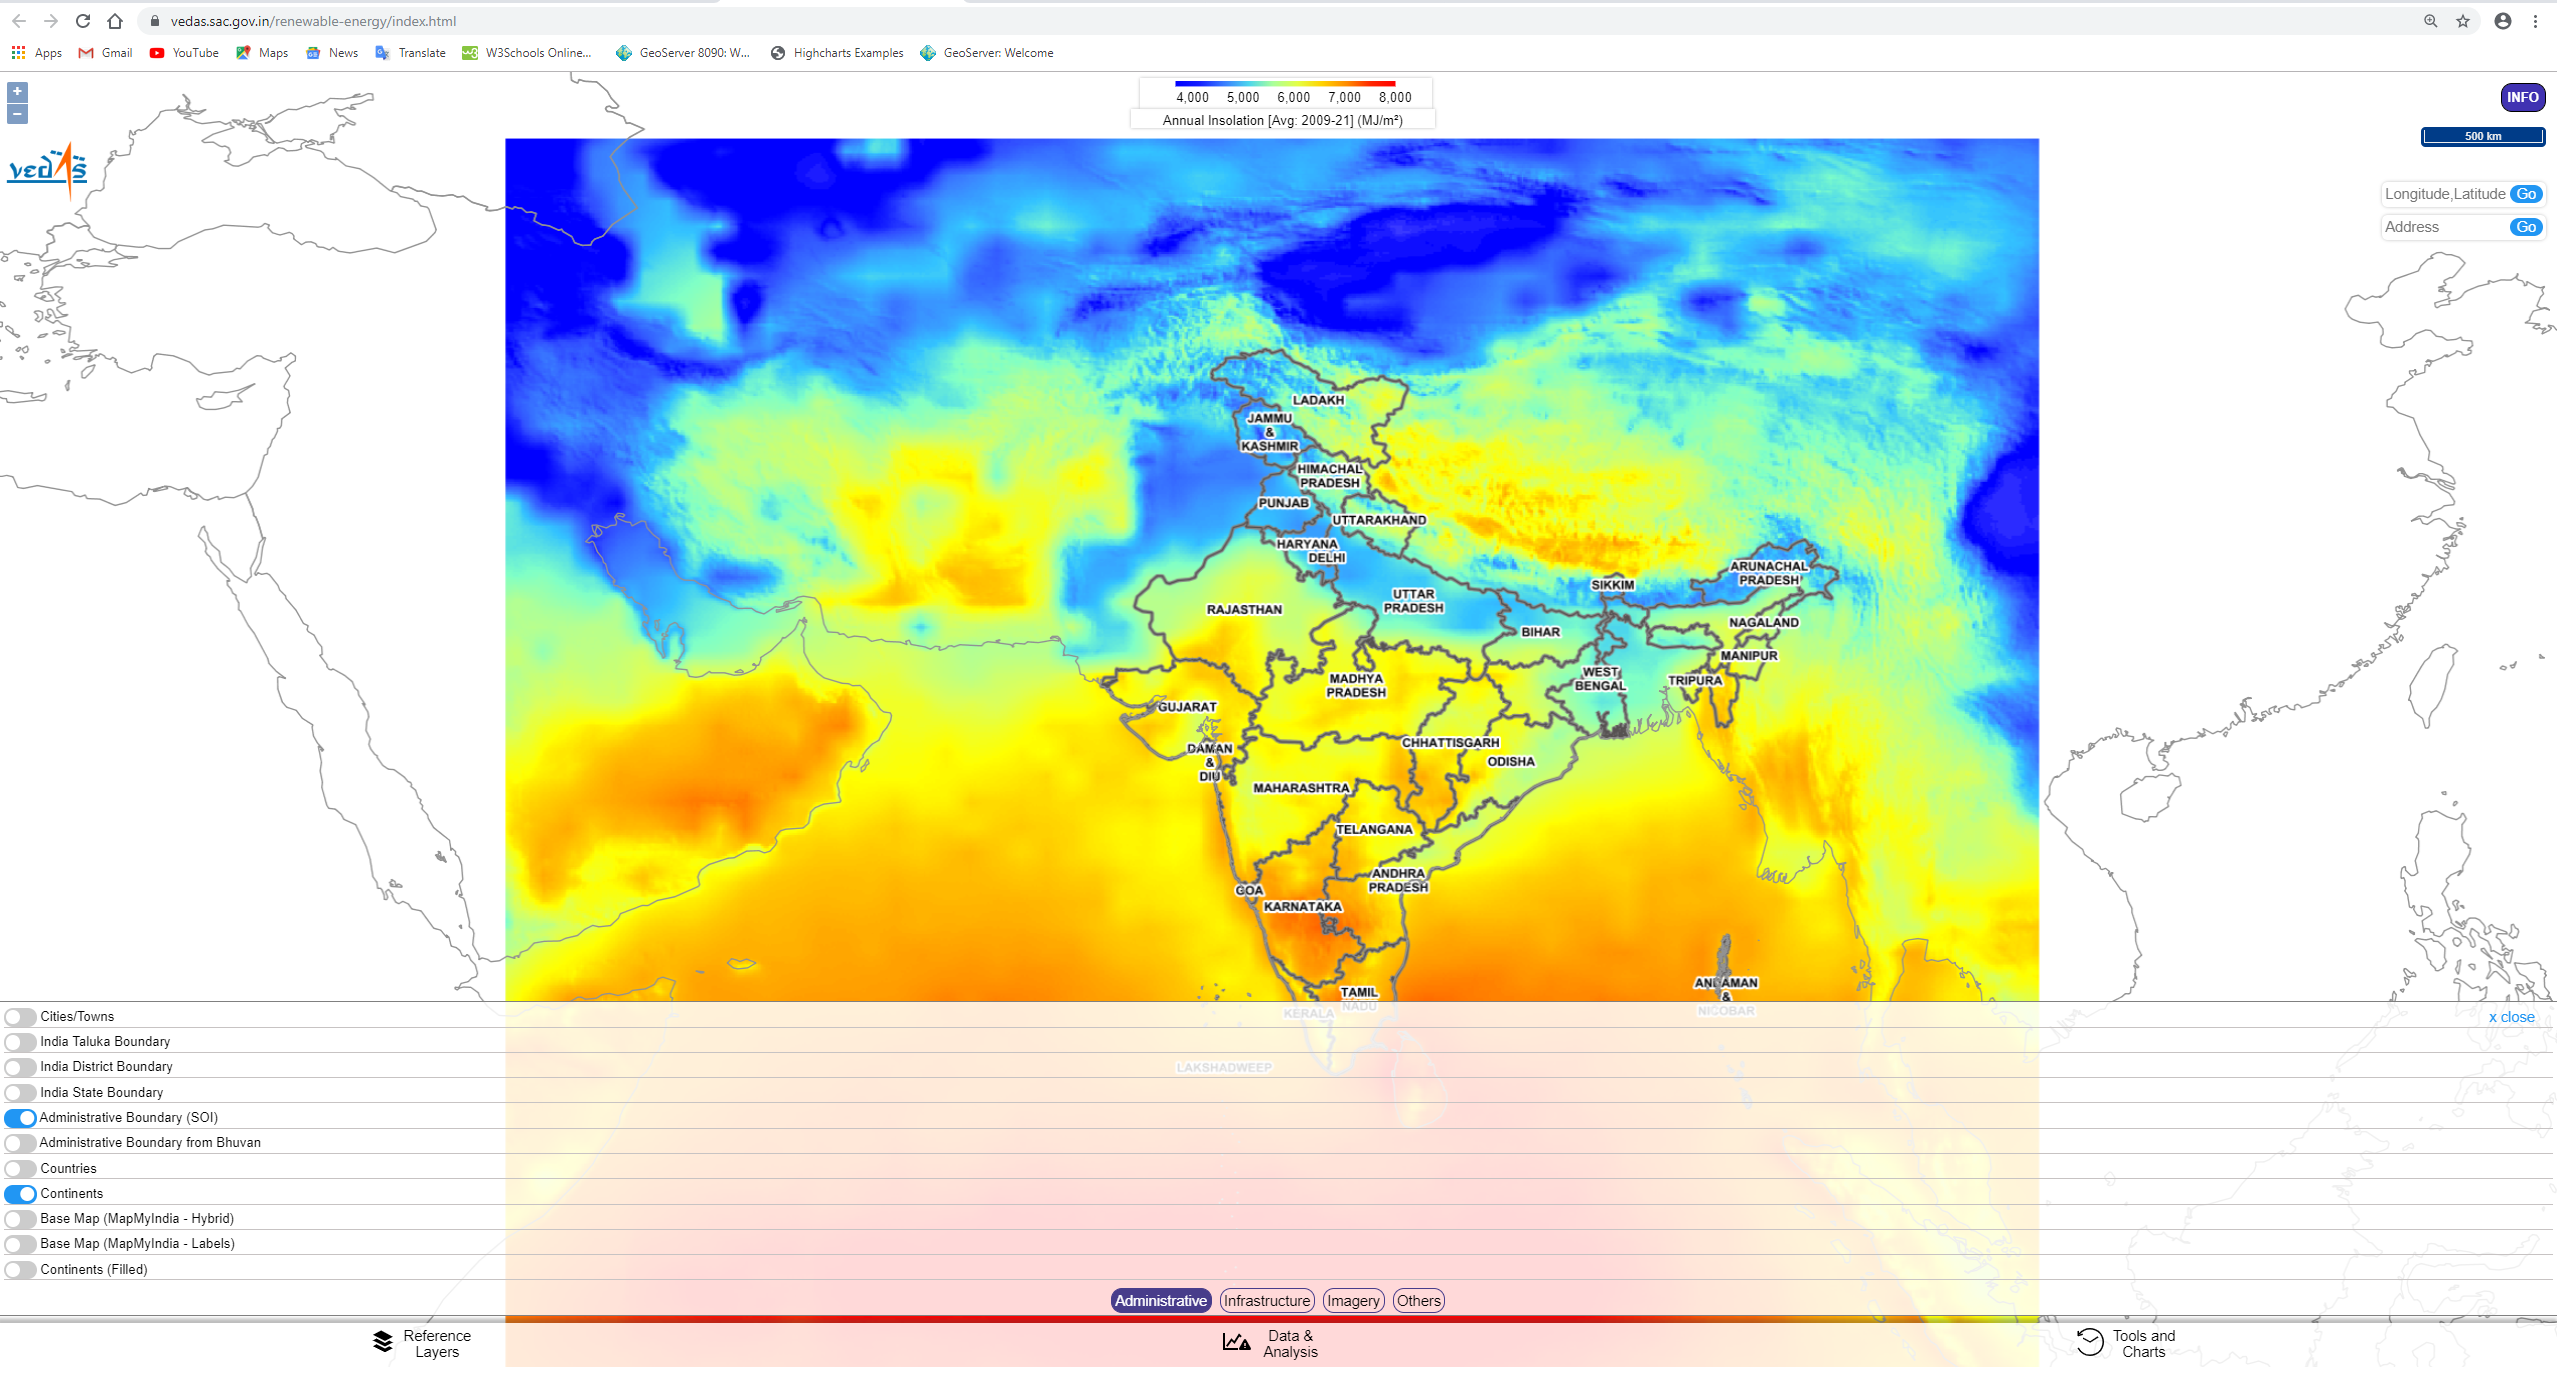
Figure 1: Reference Layers in New and Renewable Energy - Data & Analysis :
Data & Analysis tab consists of four sub tabs Solar, Wind, forecast and others.. Solar Tab includes Annual Average Insolation [Avg: 2009-21] layer generated from every half an hour solar insolation product estimated from INSAT 3D/3DR, montlhy solar insolation (available 2009 onwards), monthly optimum tilt angle estimated using solar insolation product estimated using INSAT 3D images, National institute of Wind Energy (NIWE) Products, Offshore monthly solar Insolation over ocean and Solar Calculator User Info (showing noumber of users). Monthly Solar Insolation (Bhattacharya, et al., 2013) products are generated using data derived from INSAT series of satellites as per the following details:
Satellite Data Period INSAT-3A / Kalpana-1 2009-2015 INSAT-3D 2015-2023 INSAT-3DR 2024 till date
These products are updated automatically on completion of every month.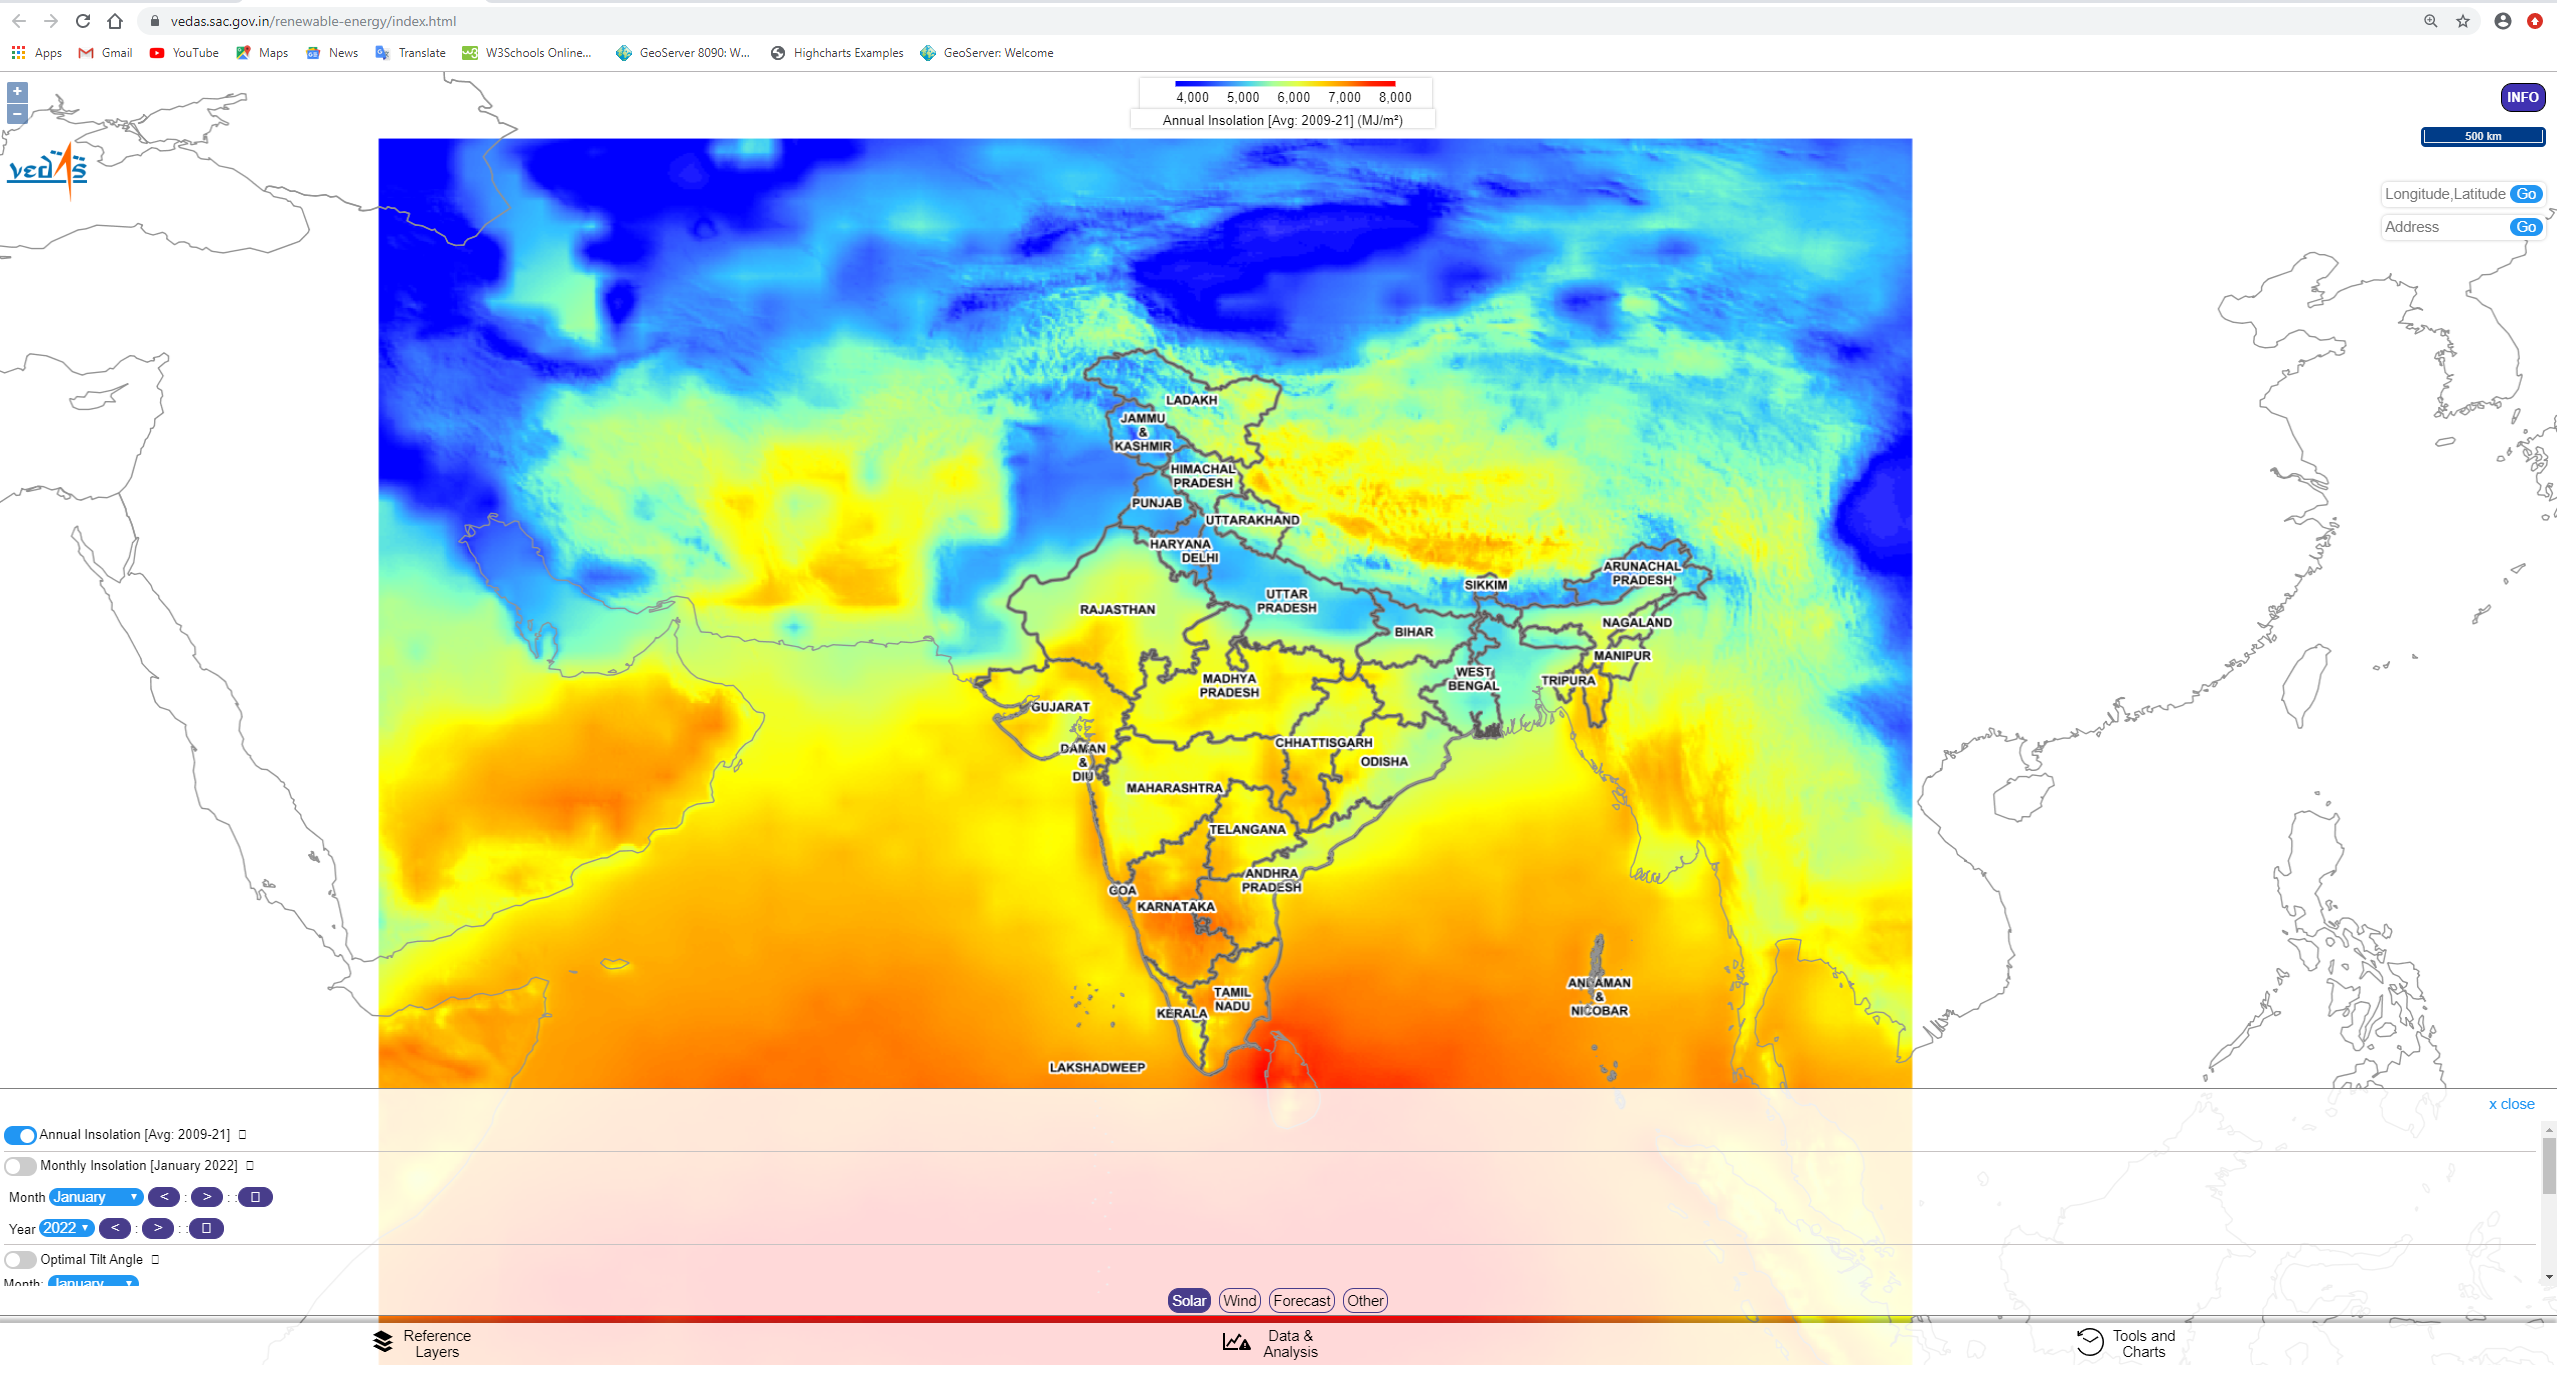
Figure 2: Data & Analysis in New and Renewable Energy - Forecast
Due to the growing demand of renewable energy, photovoltaic (PV) generation systems have increased considerably in recent years. Solar Insolation forecasting technology plays a very important role since depending on the accuracy of prediction, the amount of economic benefits from solar energy is significantly different. To cater the need of PV farm operators, Next 72 hours forecast (15-min interval) of solar insolation and temperature, next 72 hours wind and relative humidity forecast (3 hours interval) are generated on daily basis using Numerical Weather Predication model (NWP). These forecast datasets are published as OGC (Open Geospatial Consortium) compliant Time enabled Web Map Services (WMS) and animation for same is also available on VEDAS.
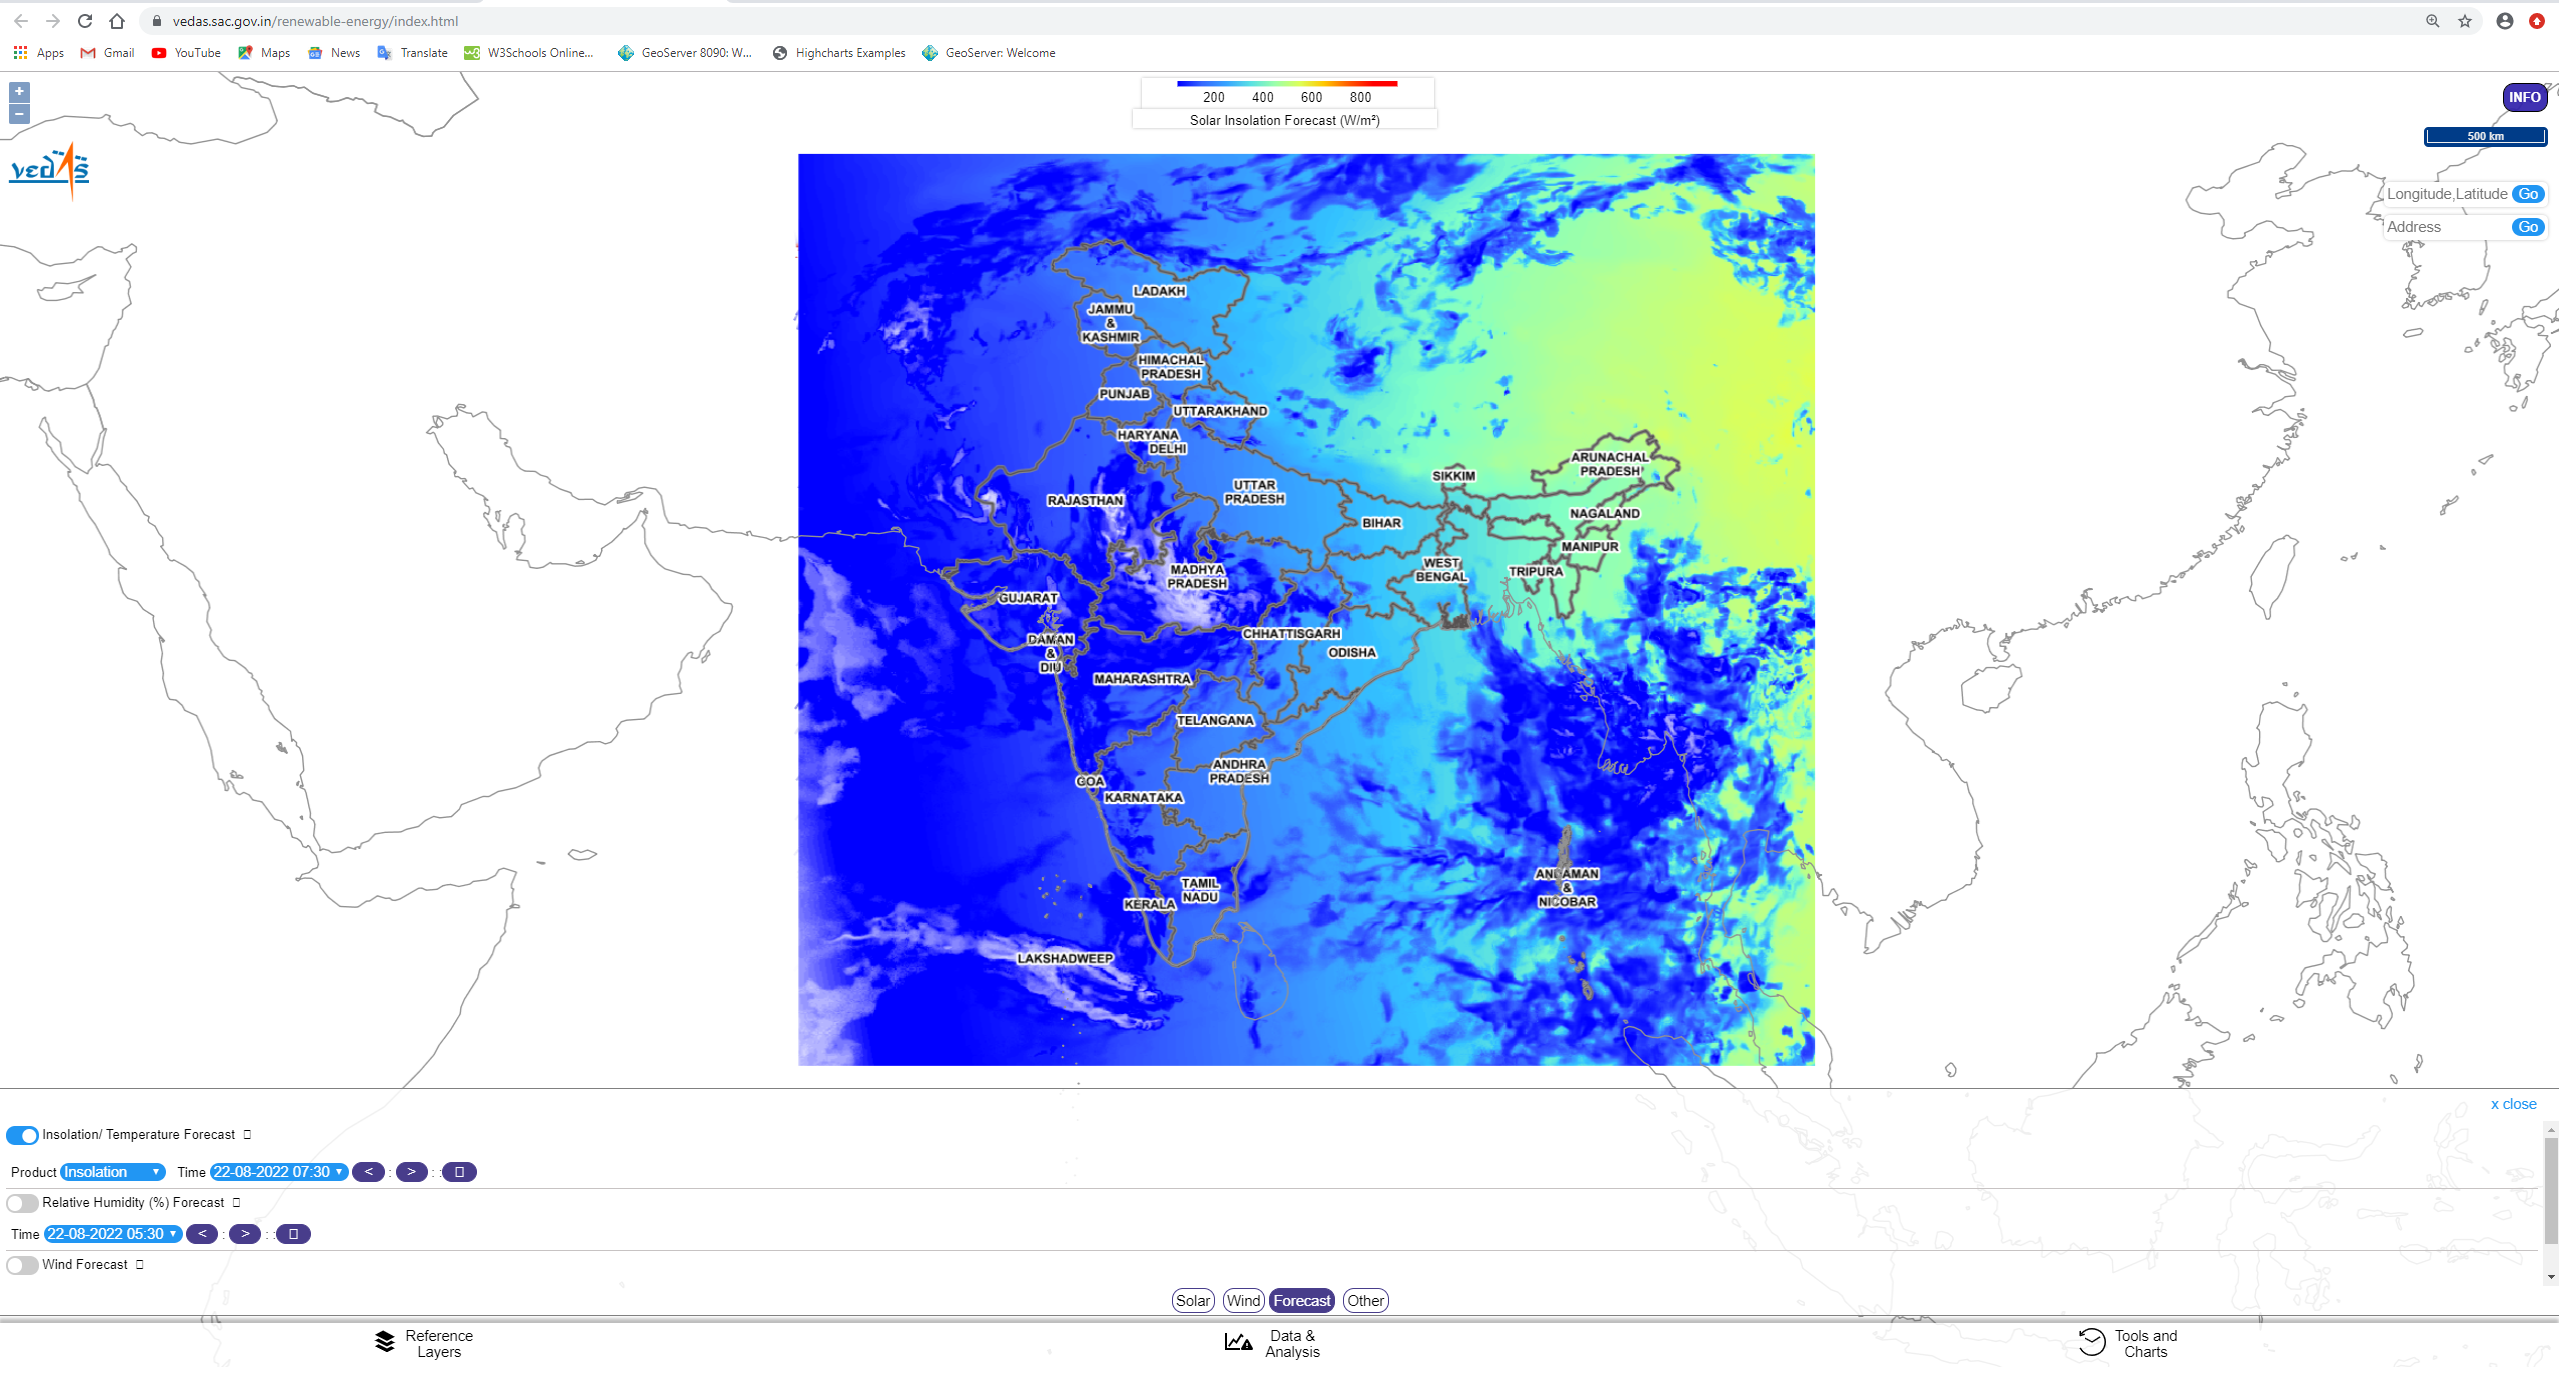
Figure 2.1.1: Solar Insolation and Temperature Forecast 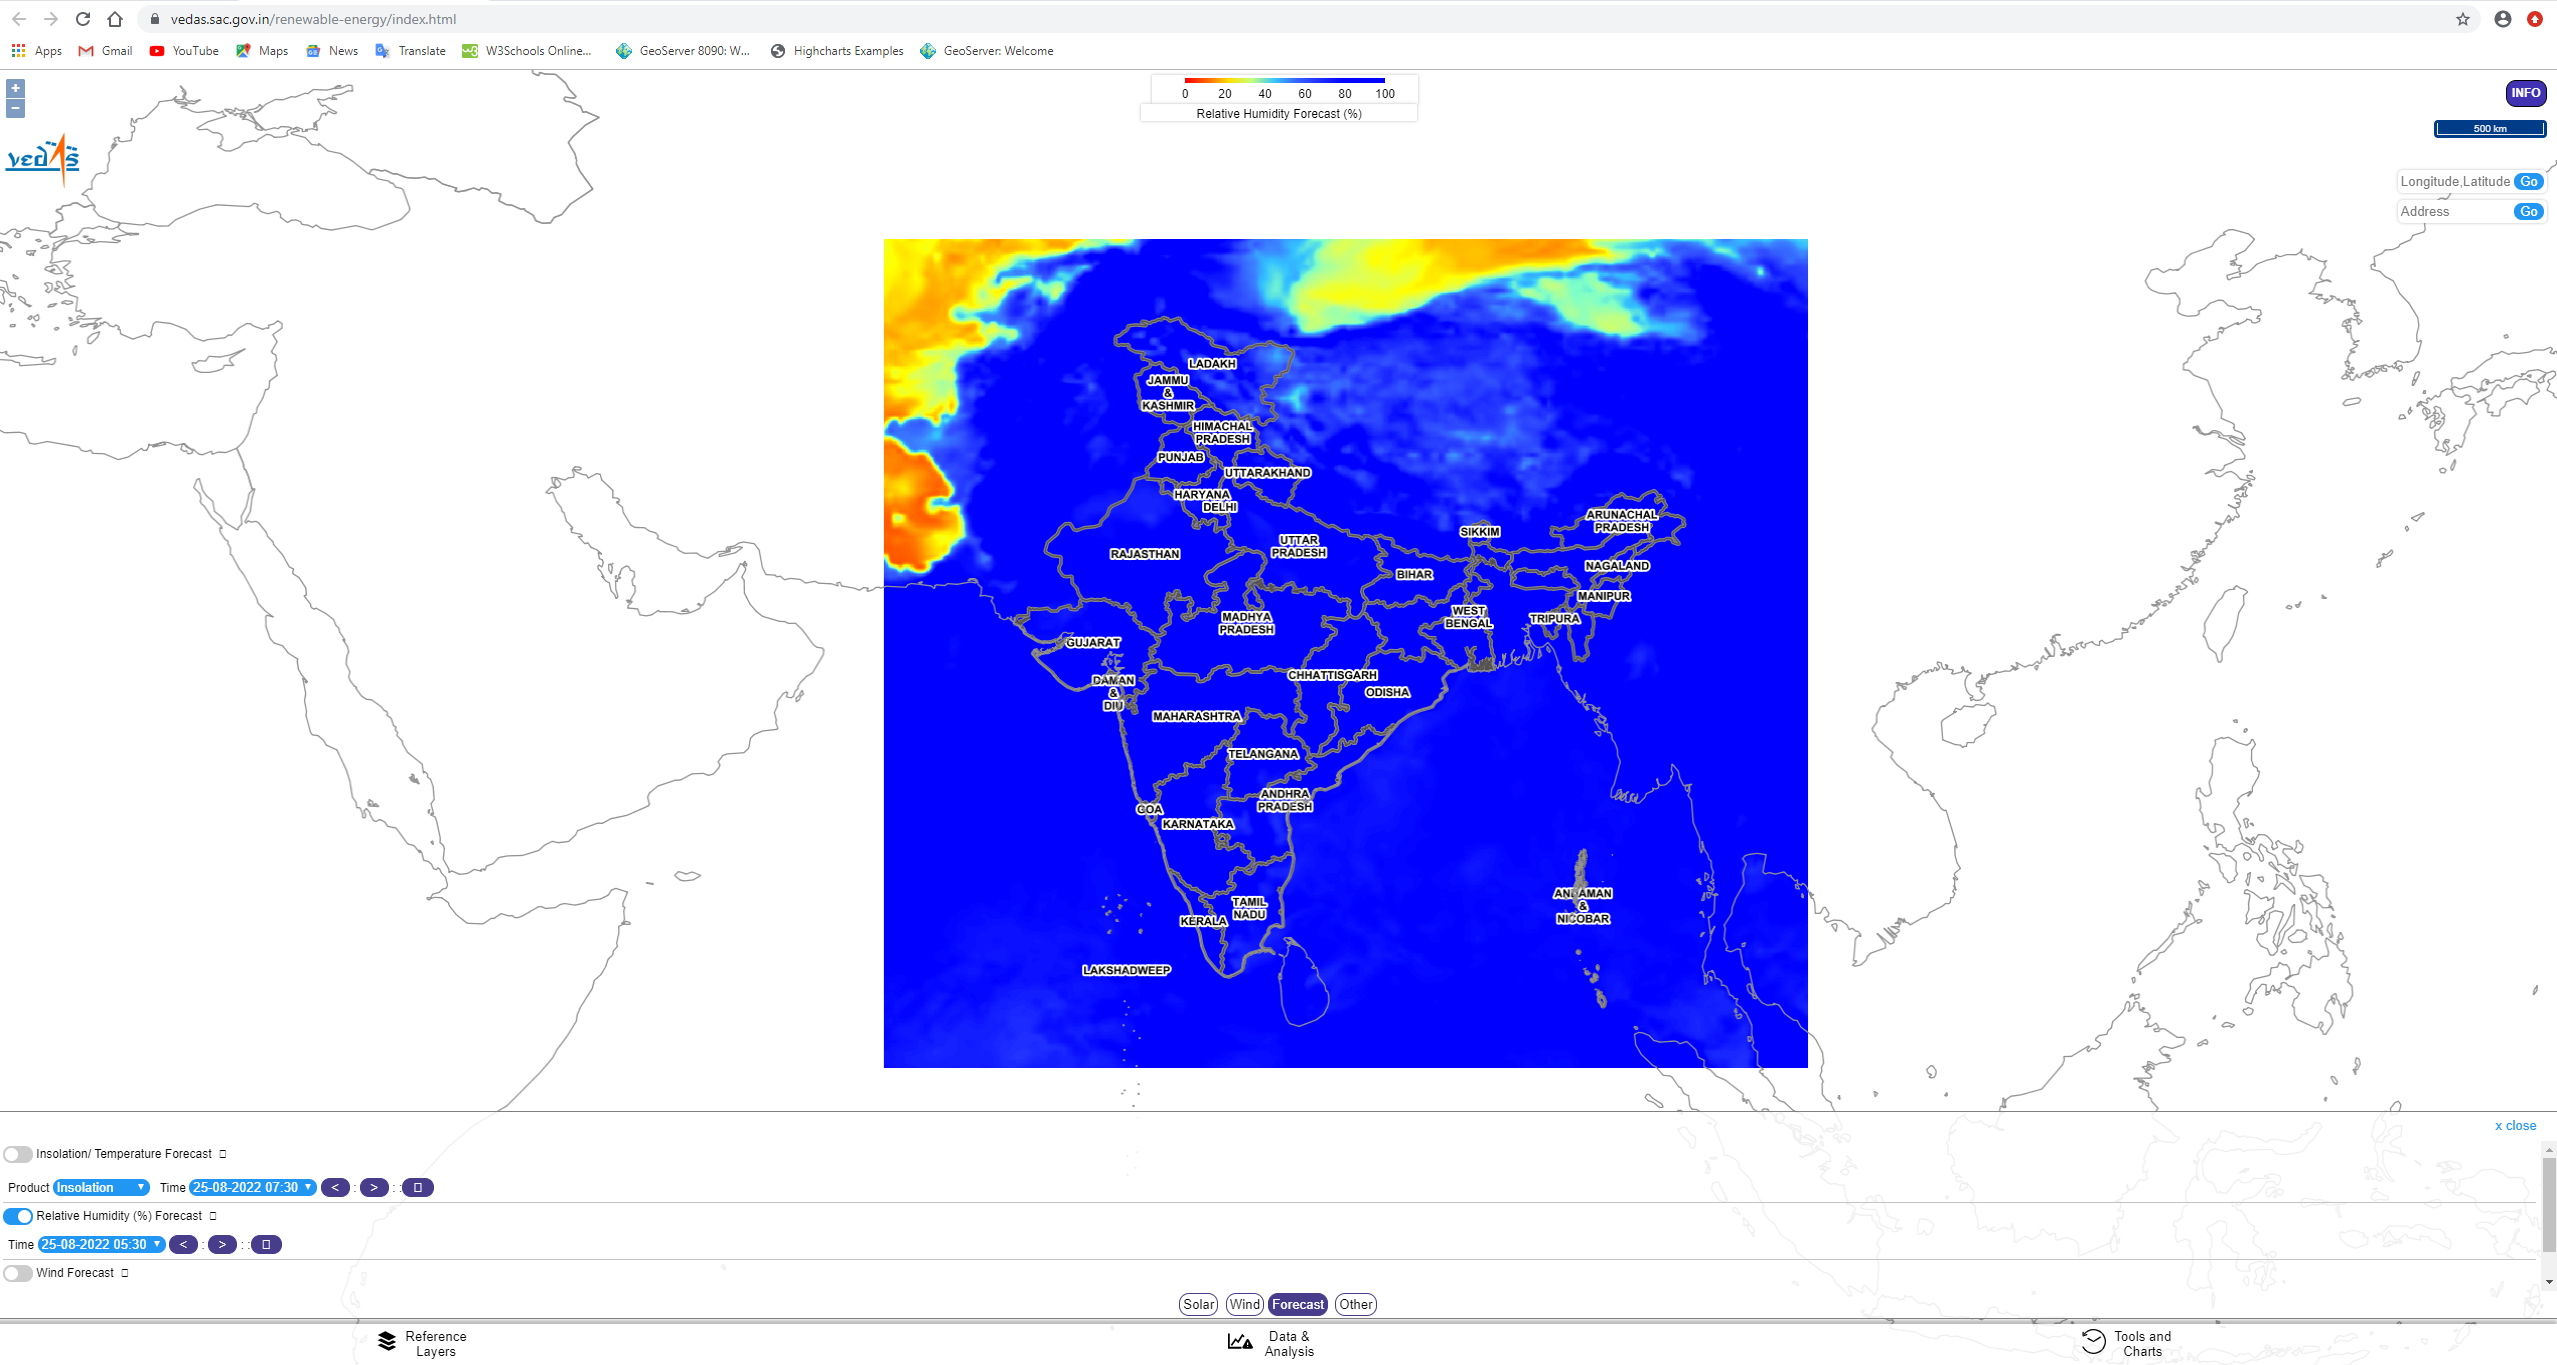
Figure 2.1.2: Relative Humidity Forecast
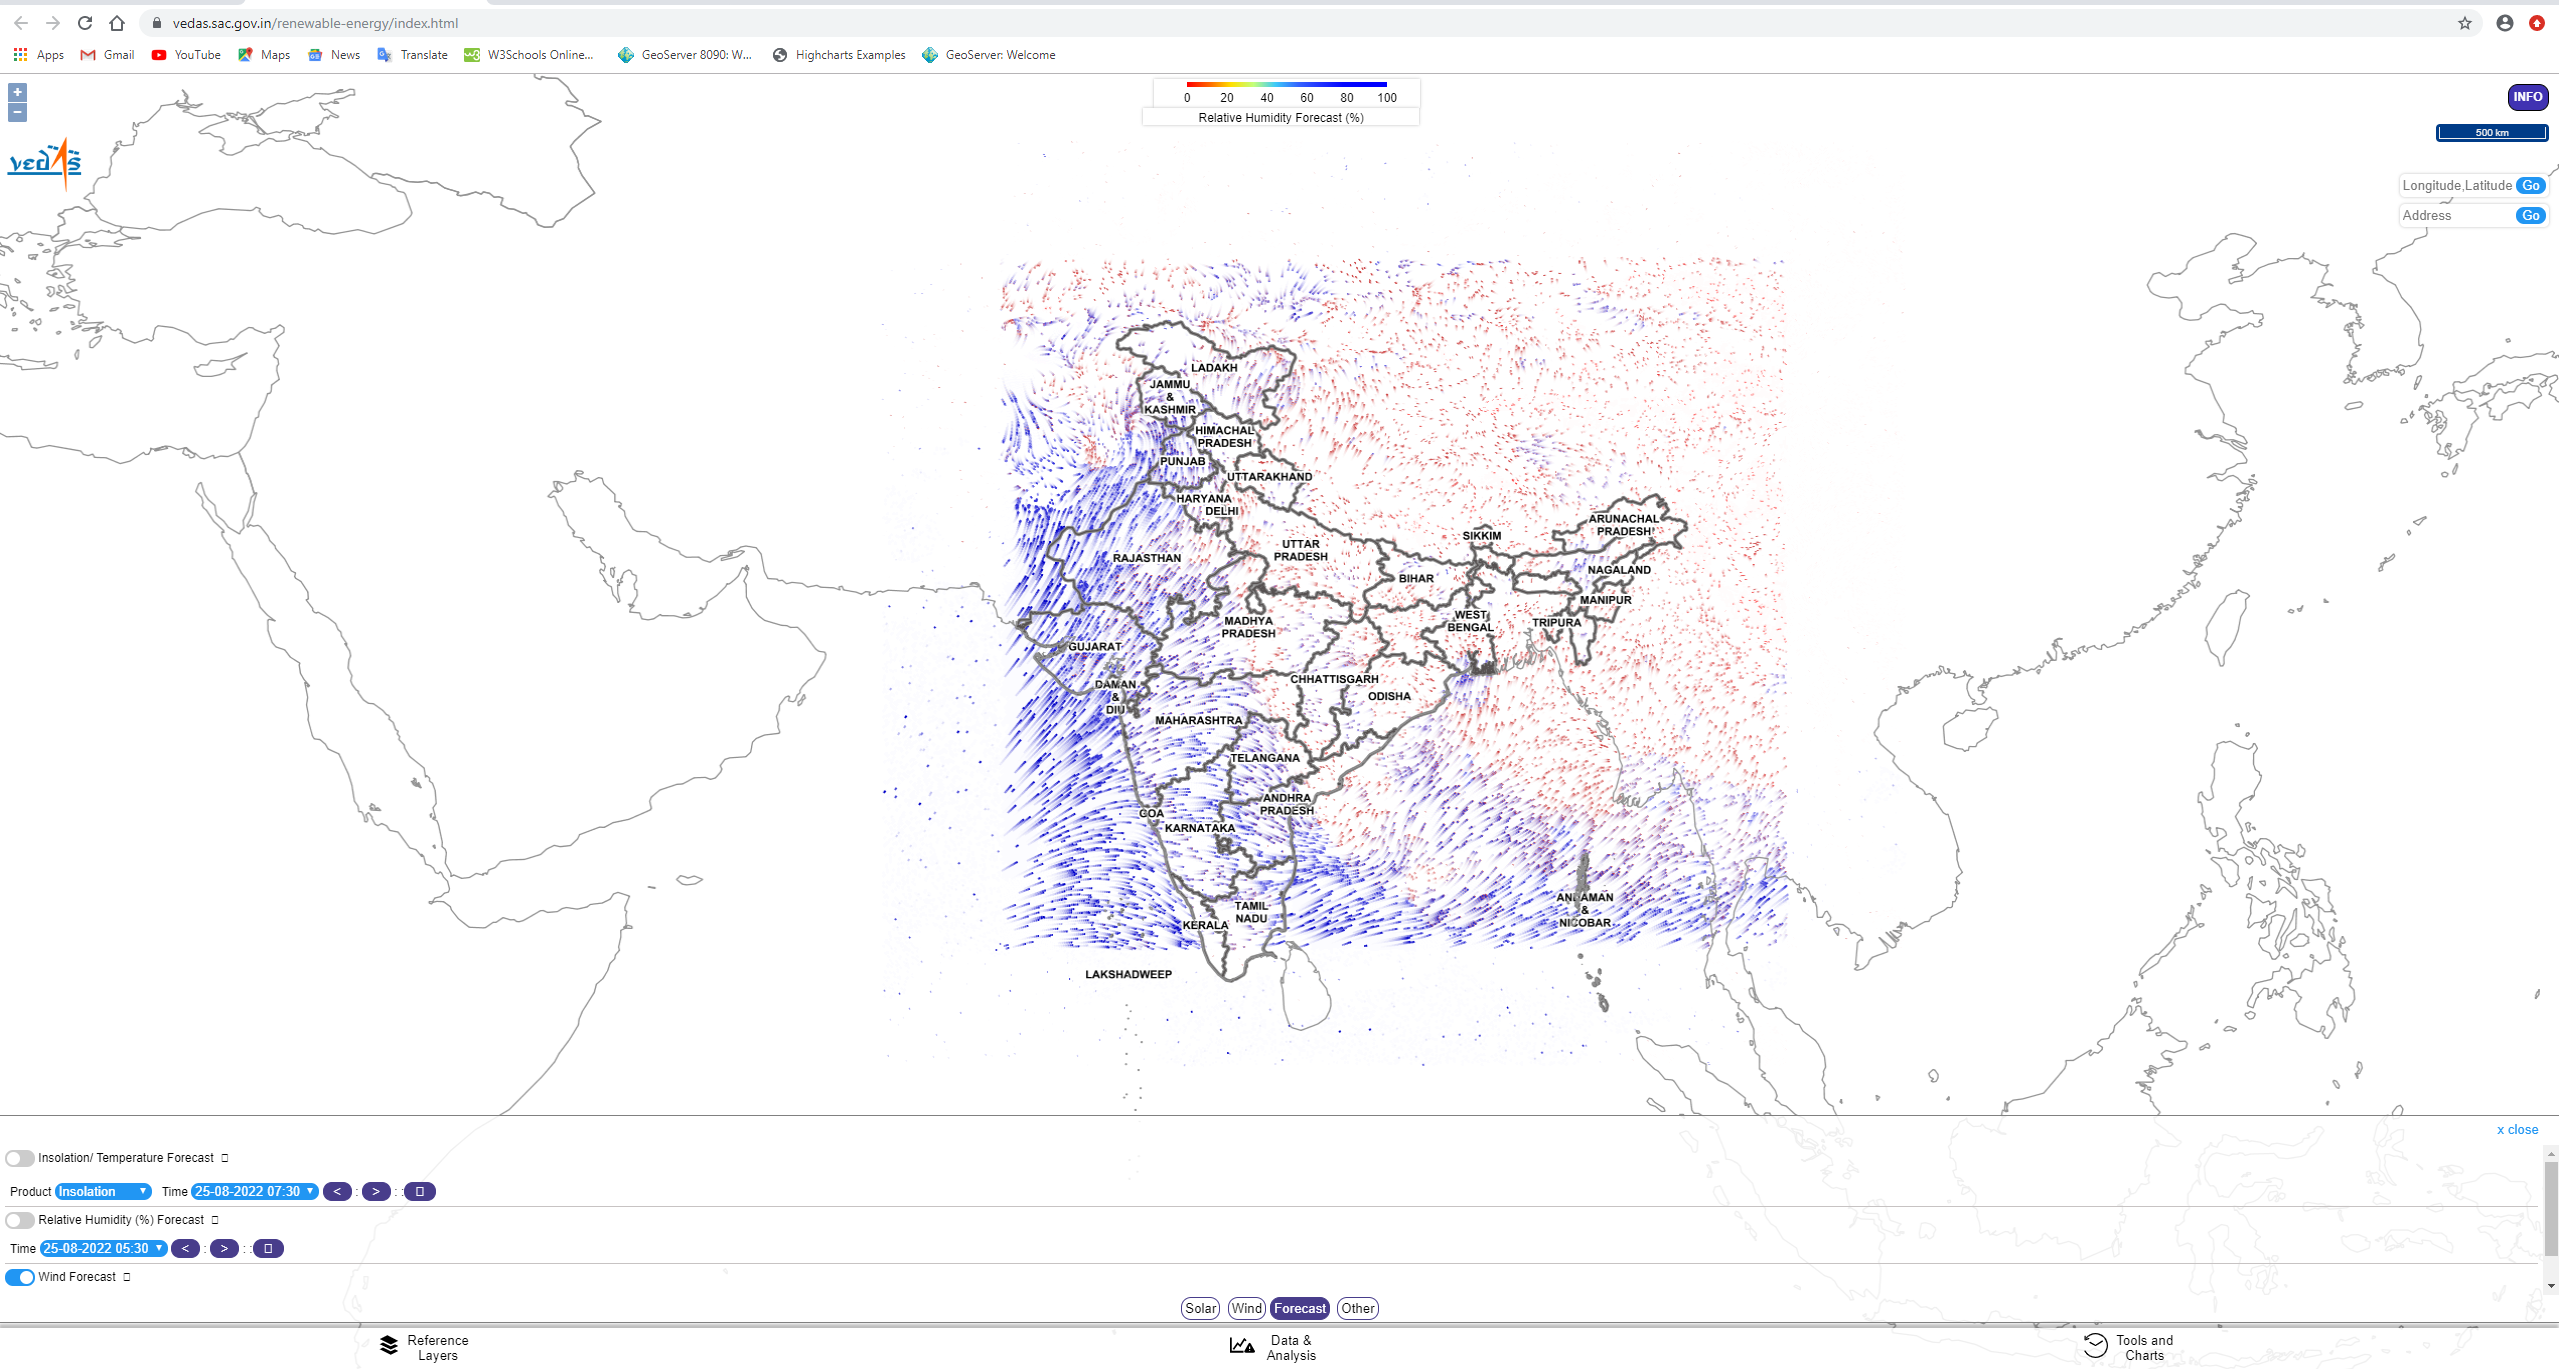
Figure 2.1.3: Wind Forecast - Wind energy :
Wind energy is the second fastest growing source of electricity in the world. Harnessing energy from wind and converting into electricity has several advantages. So to exploit wind energy from vast coastline of India which cover 7600 km and land, the VEDAS web-portal provides information on monthly wind energy potential. The ocean wind energy is derived from scatterometer data. India’s Oeansat -2 OSCAT, an active Ku-band (13.515 GHz) microwave payload, and QSCAT provide data to retrieve wind speed and direction. OSCAT has a spatial resolution of 50 kmThe interface is designed to assess monthly average wind power potential. Wind forecast for next 72 hours at 3-hour interval generated from Weather Research Forecast (WRF) model is also available under forecast tab.
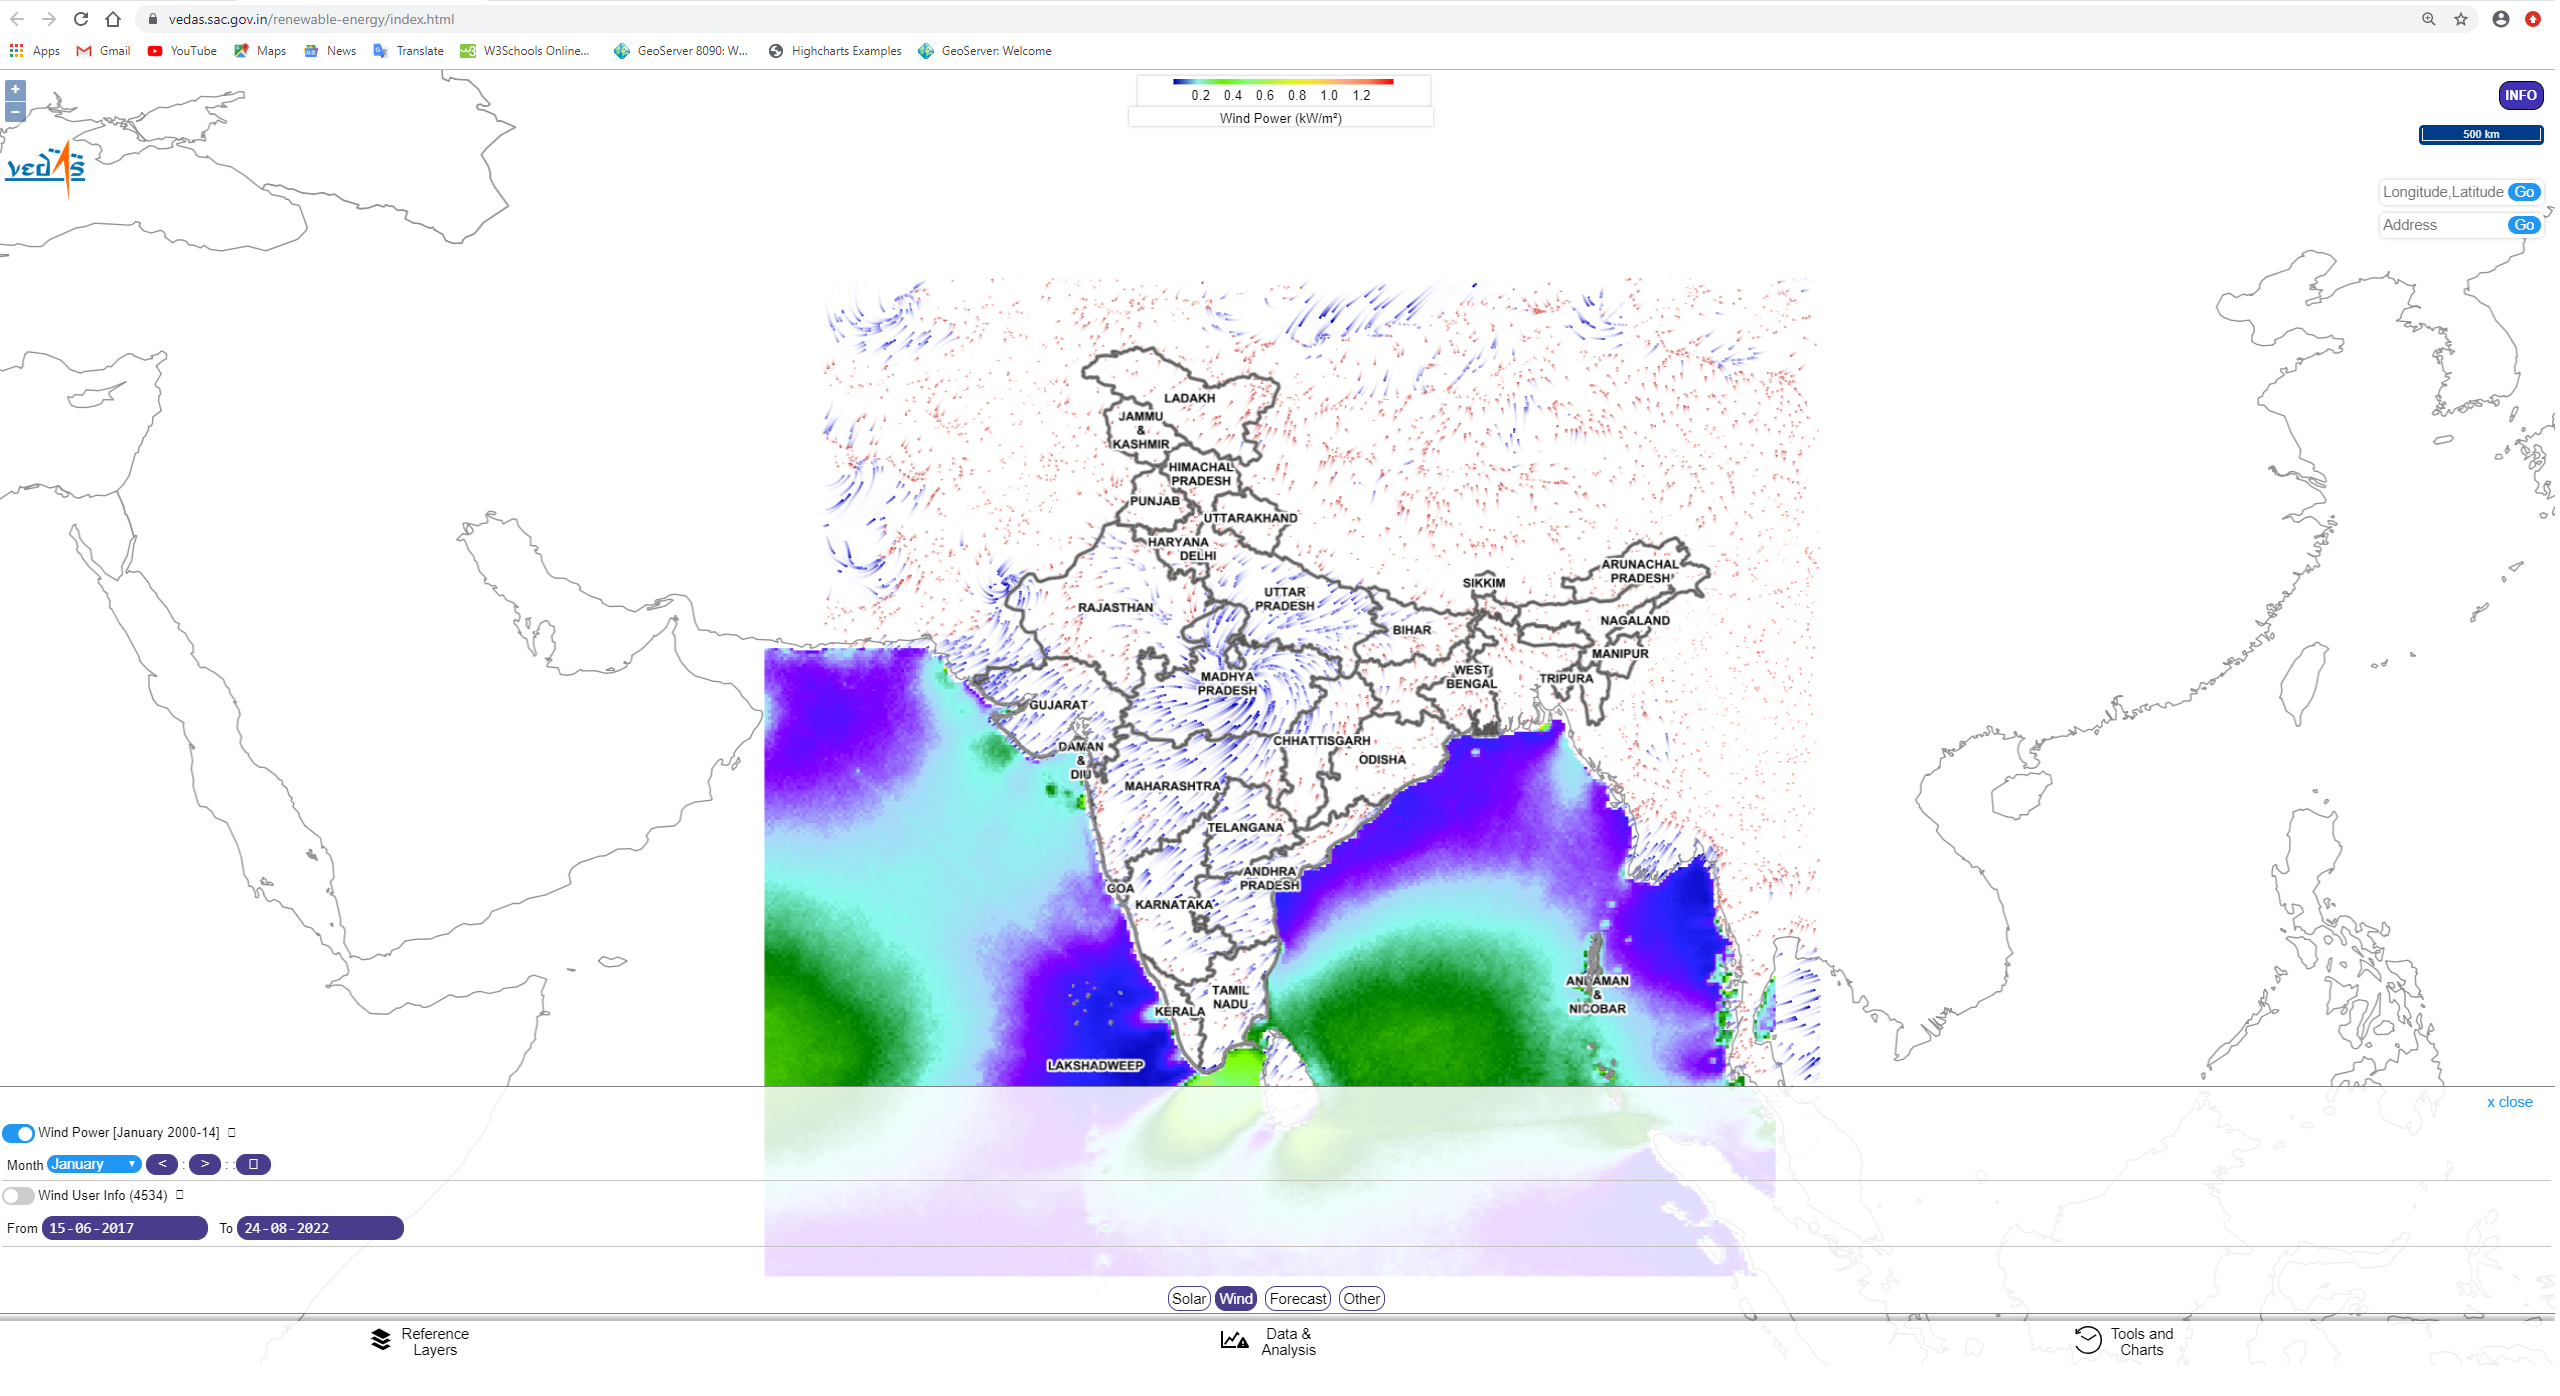
Figure 2.2.1: Wind energy 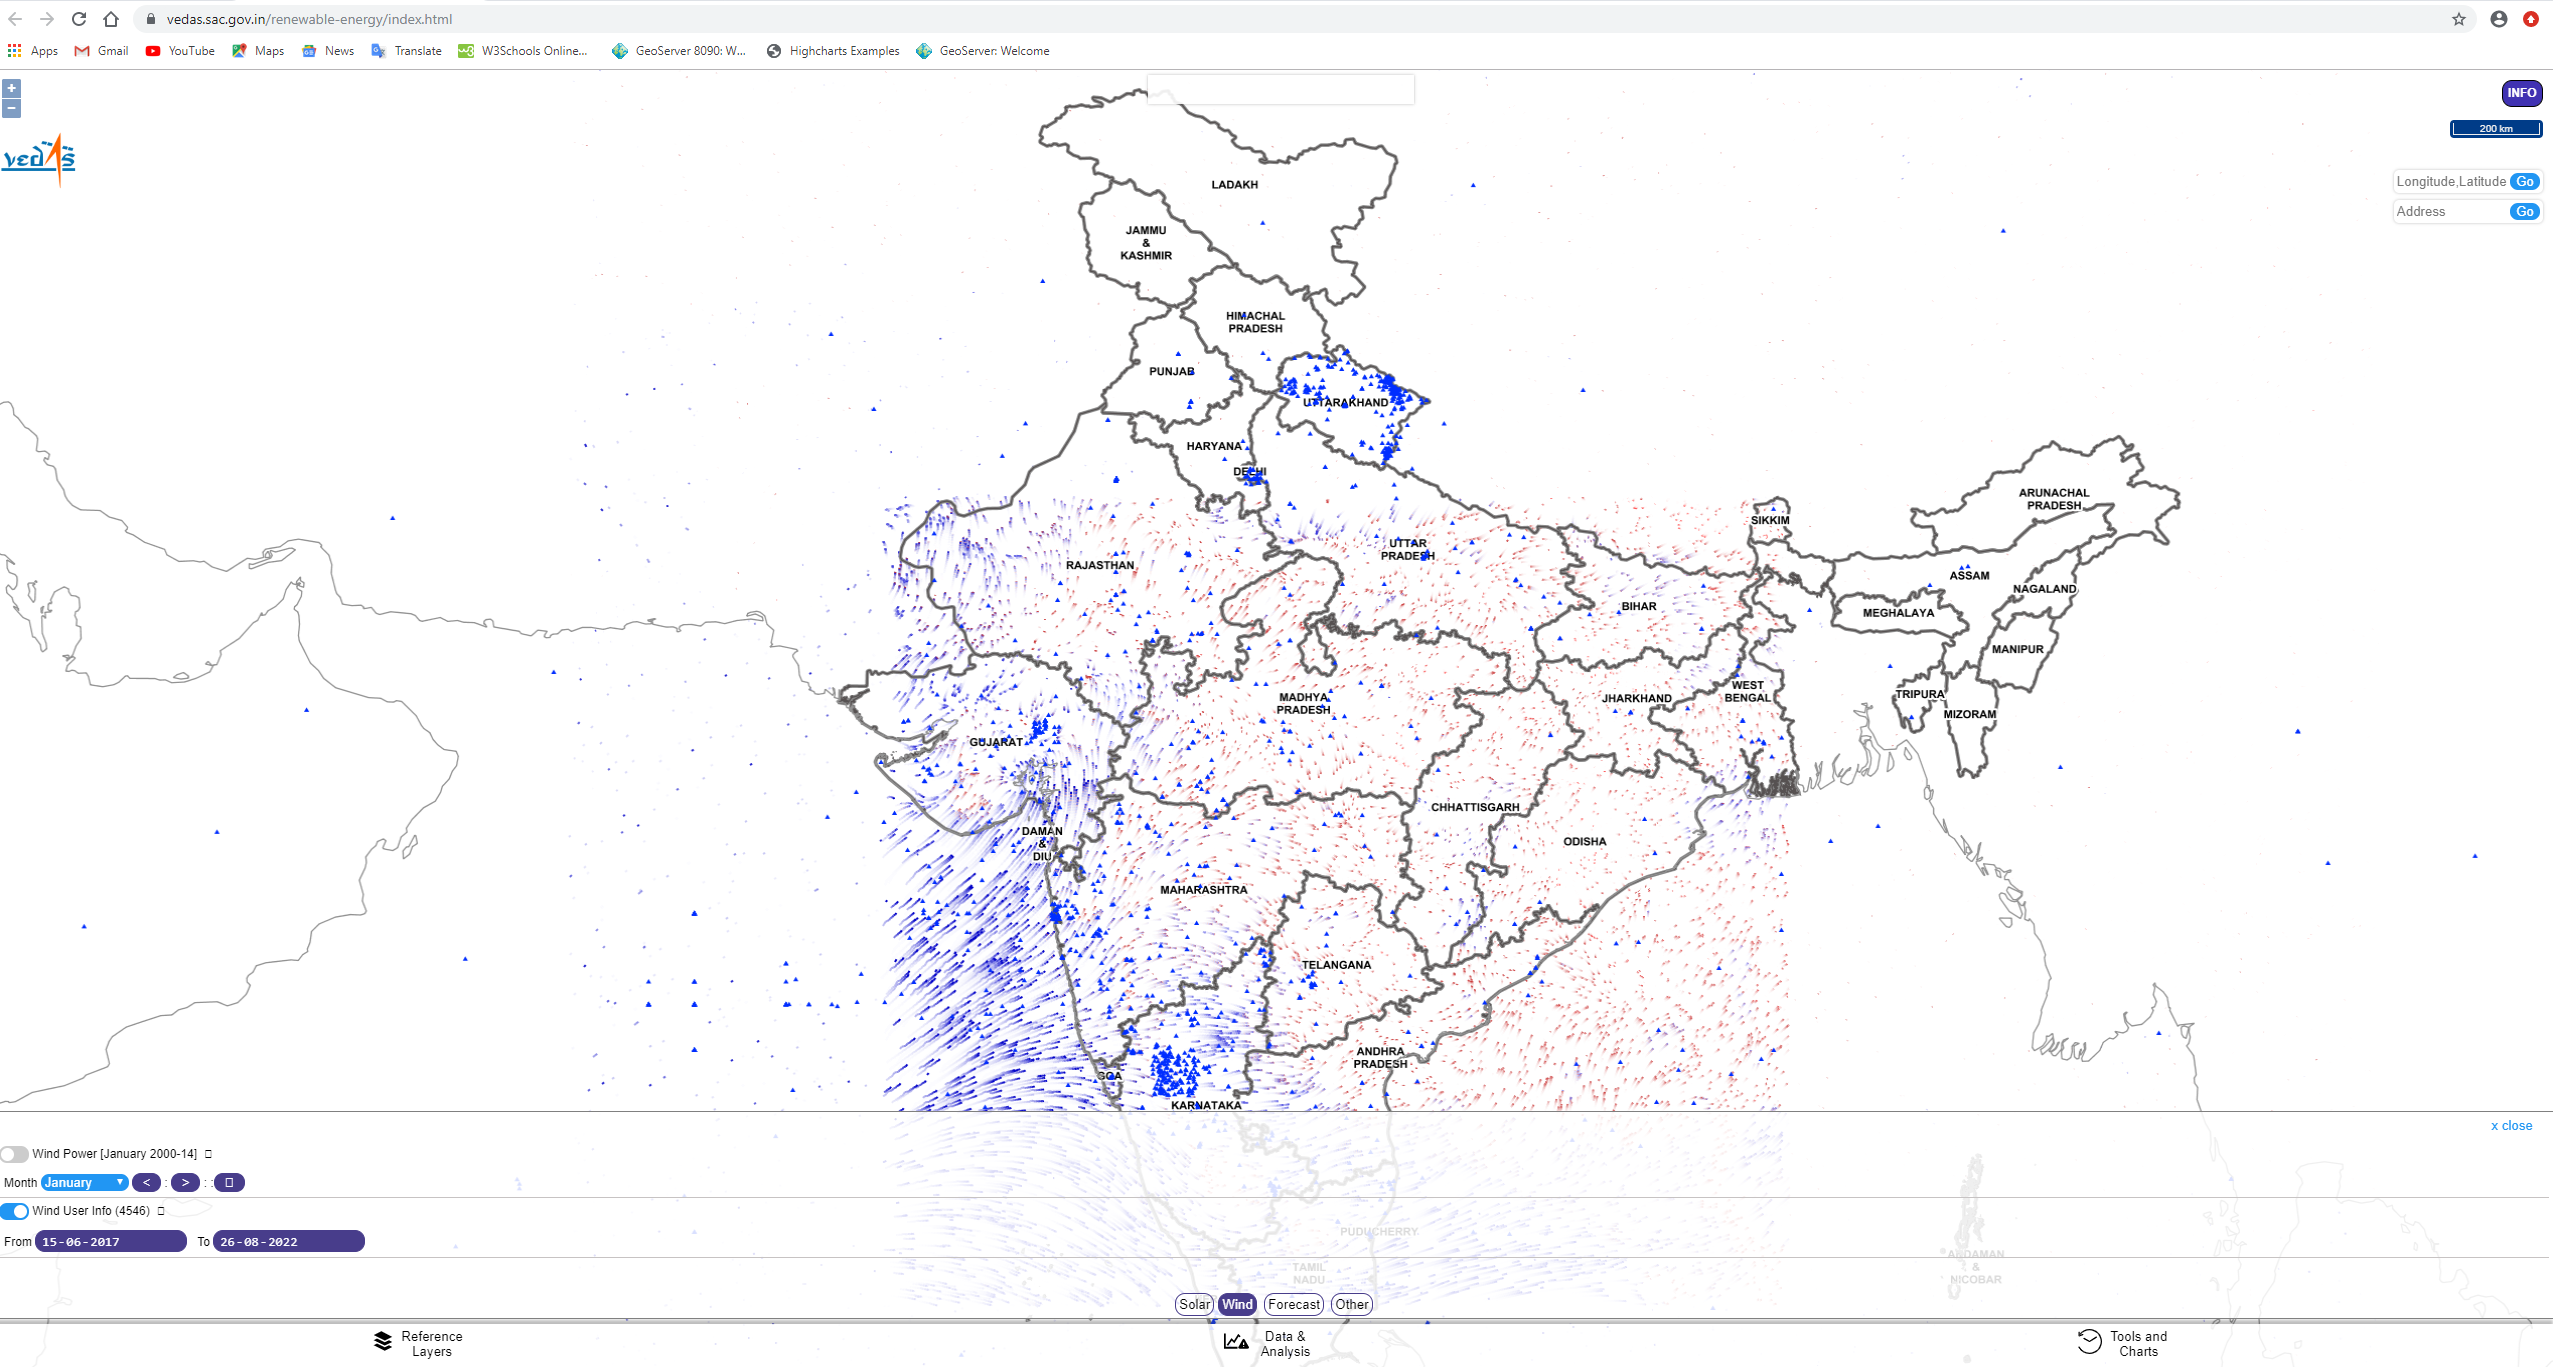
Figure 2.2.2: Wind energy User Info -
Wave Energy :
Ocean wave has enormous energy potential and it is harnessed from sea waves. It is one of the most sustainable energy source. The rigorous vertical motion of sea waves contains lot of kinetic energy which can be further use for electricity generation, desalinization of water etc. To exploit wave energy, VEDAS provides information about wave height, wave power and wave periods in form of WMS Services.
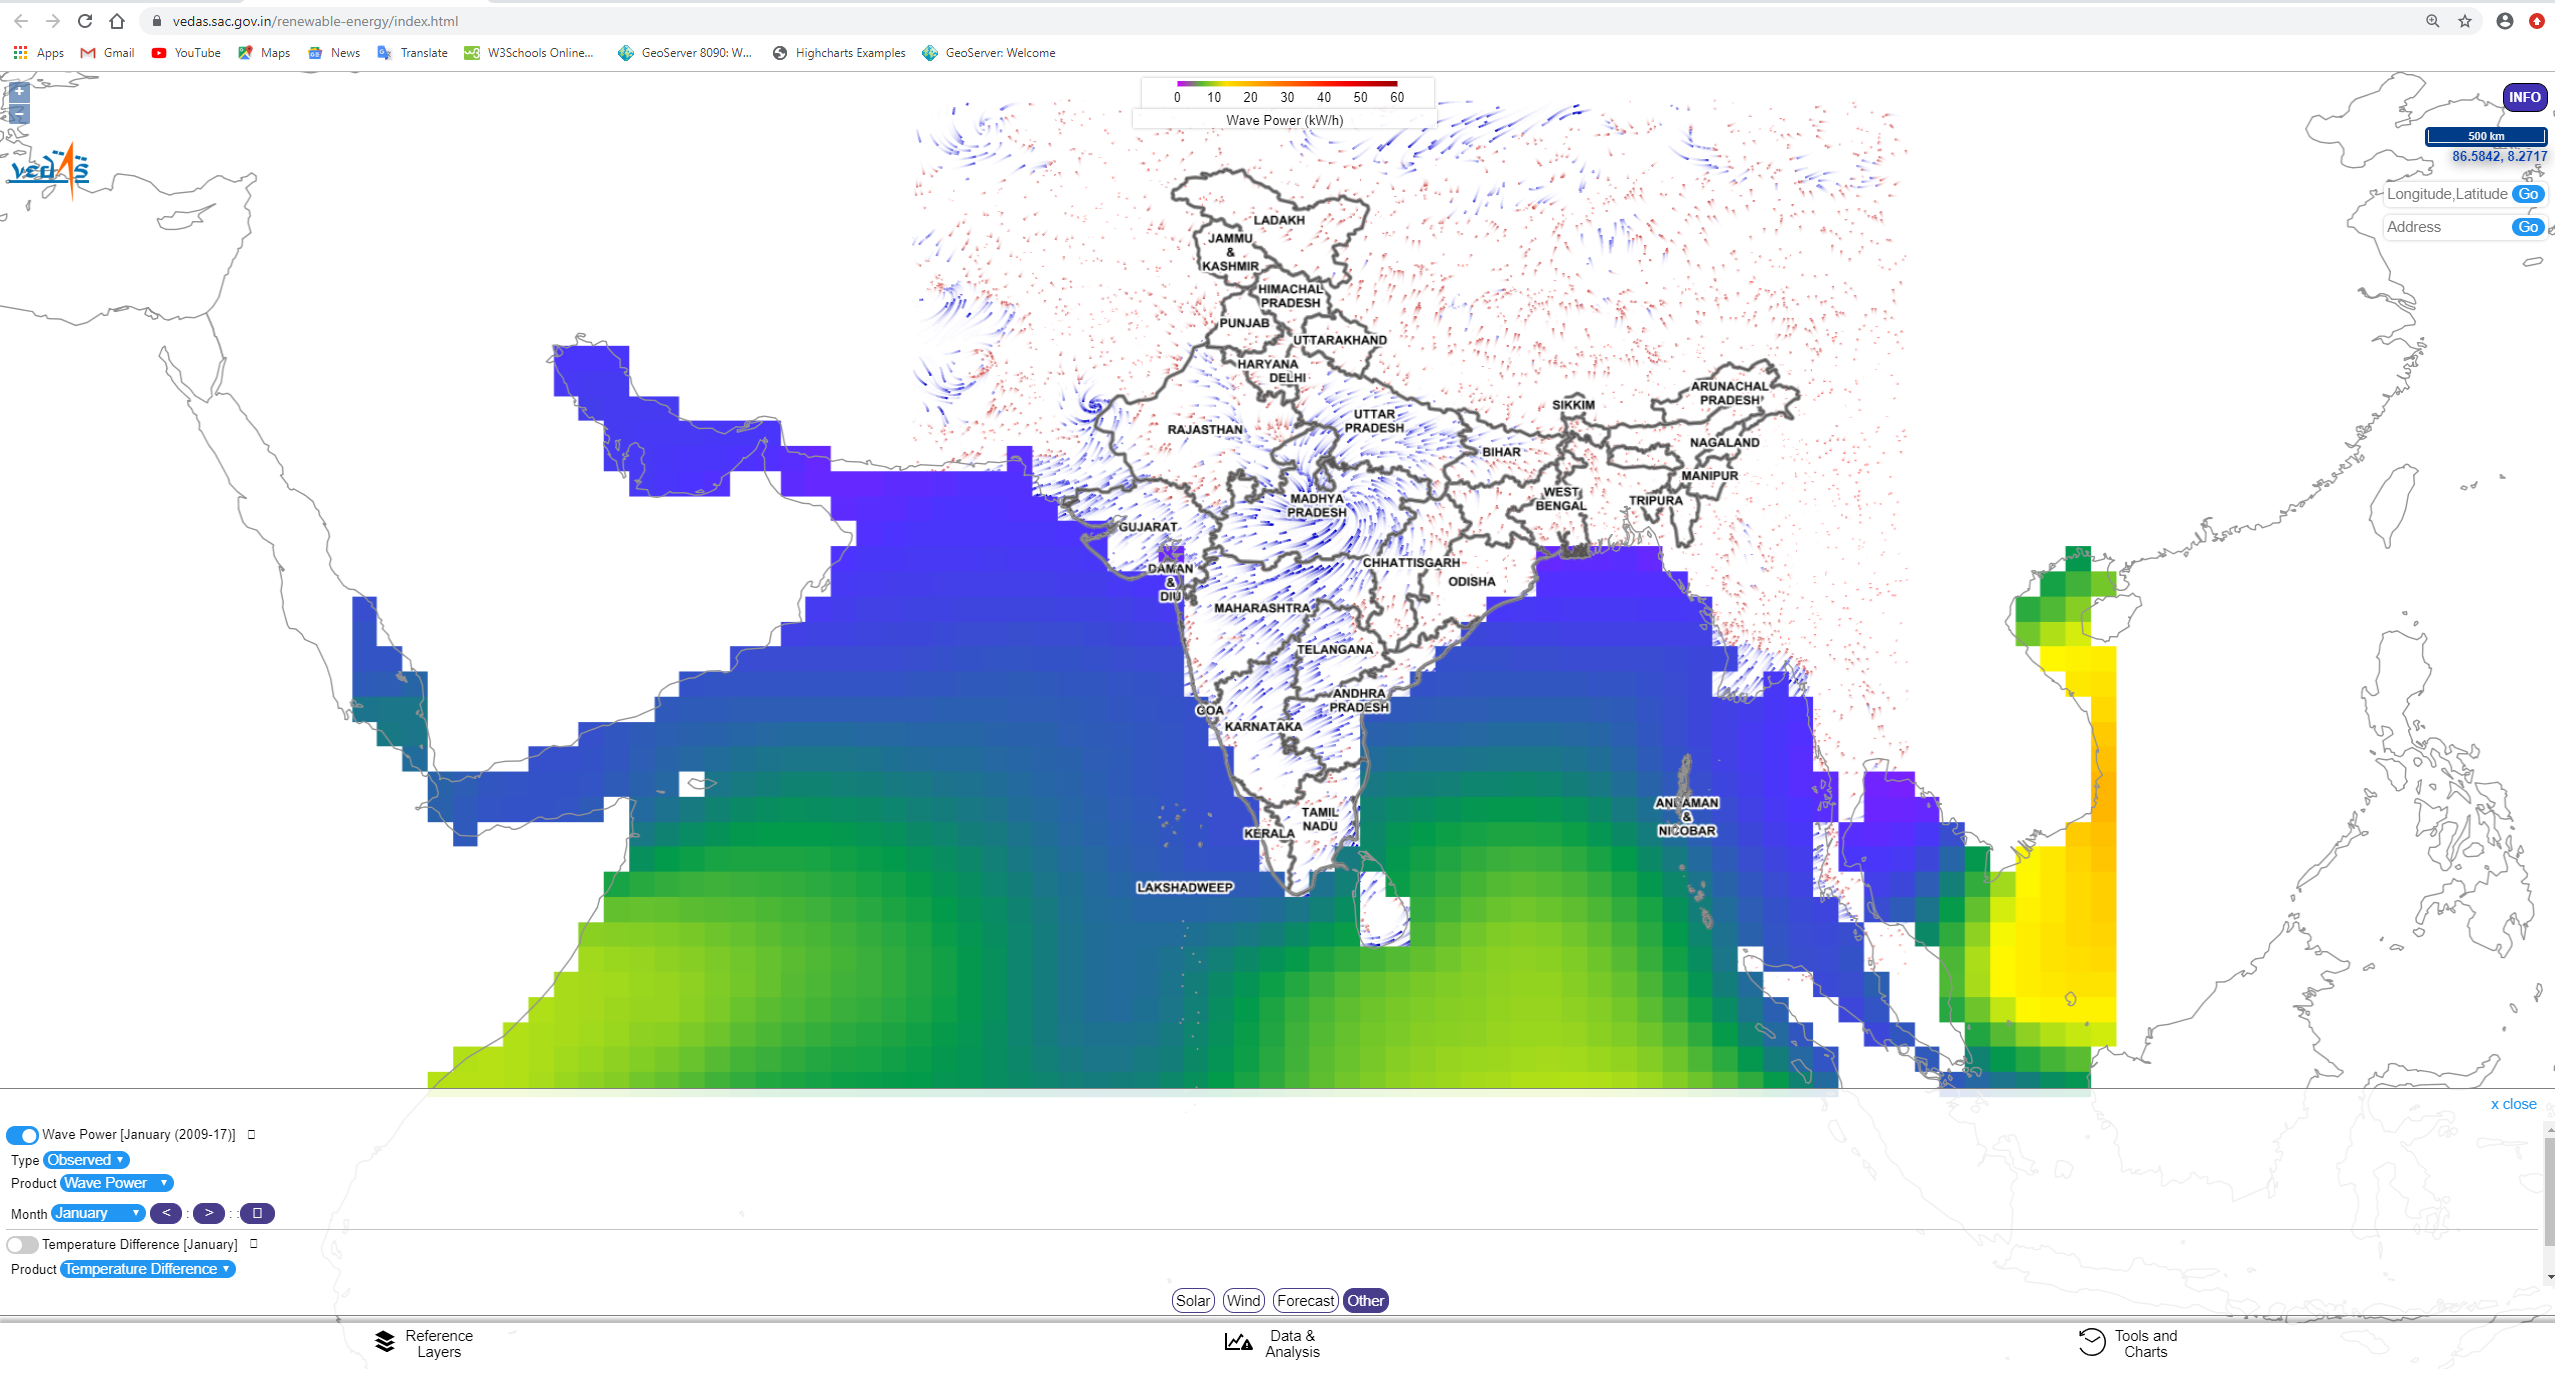
Figure 2.2.3: Wave energy - Tools and Charts
Under Tools and Charts menu, Feature Info, Solar Calculator, and Solar Site Selection Tool options are available. Feature Info facilitates to provide information for the given layer at clicked location on visible layer in the map. Solar Calculator provides the information about solar insolation, temperature, tilt angle, DNI (Direct Normal Irradiance), GHI (Global Horizontal Irradiance), day length, and sun path in tabular and graphical format for clicked location on the map. User can also download this information in PDF format. By clicking on the Solar Site Selection Tool link, user is redirected to another web application. It is a tool for performing multi criteria analysis based on various parameters to visualise optimum area to install solar power plants.
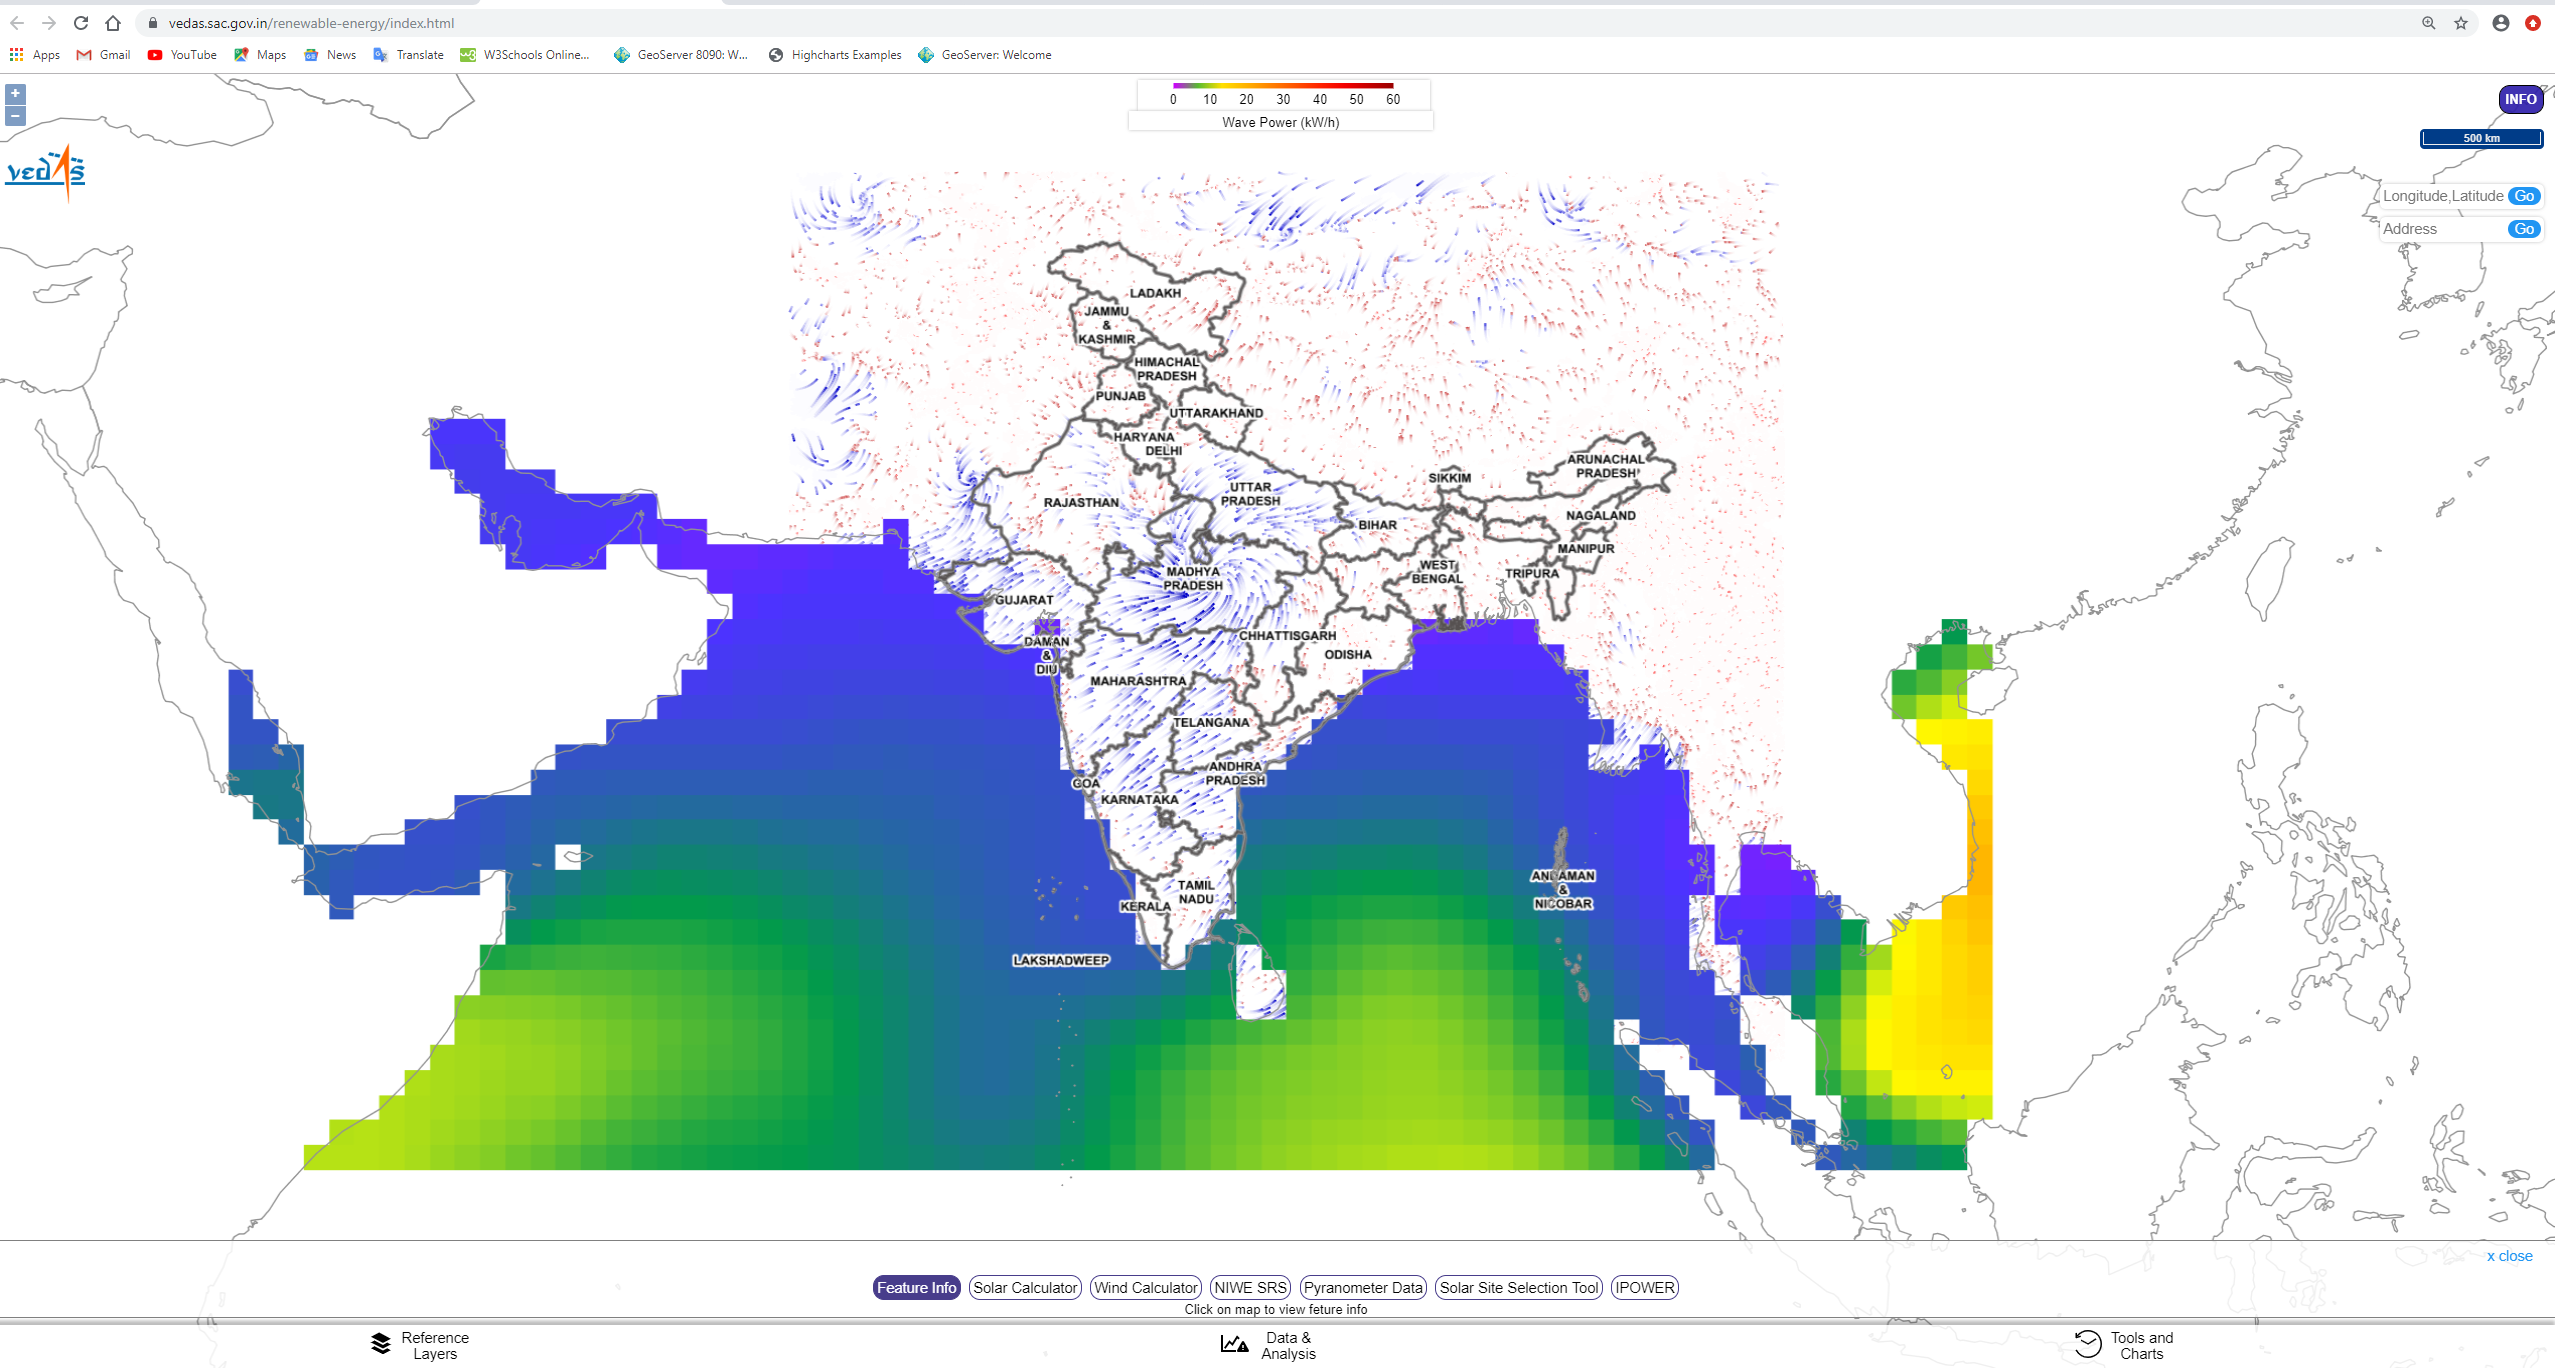
Figure 3.1: Tools and Charts - Feature Info:
When user clicks on the map, the feature information is displayed for that layer at a clicked location.
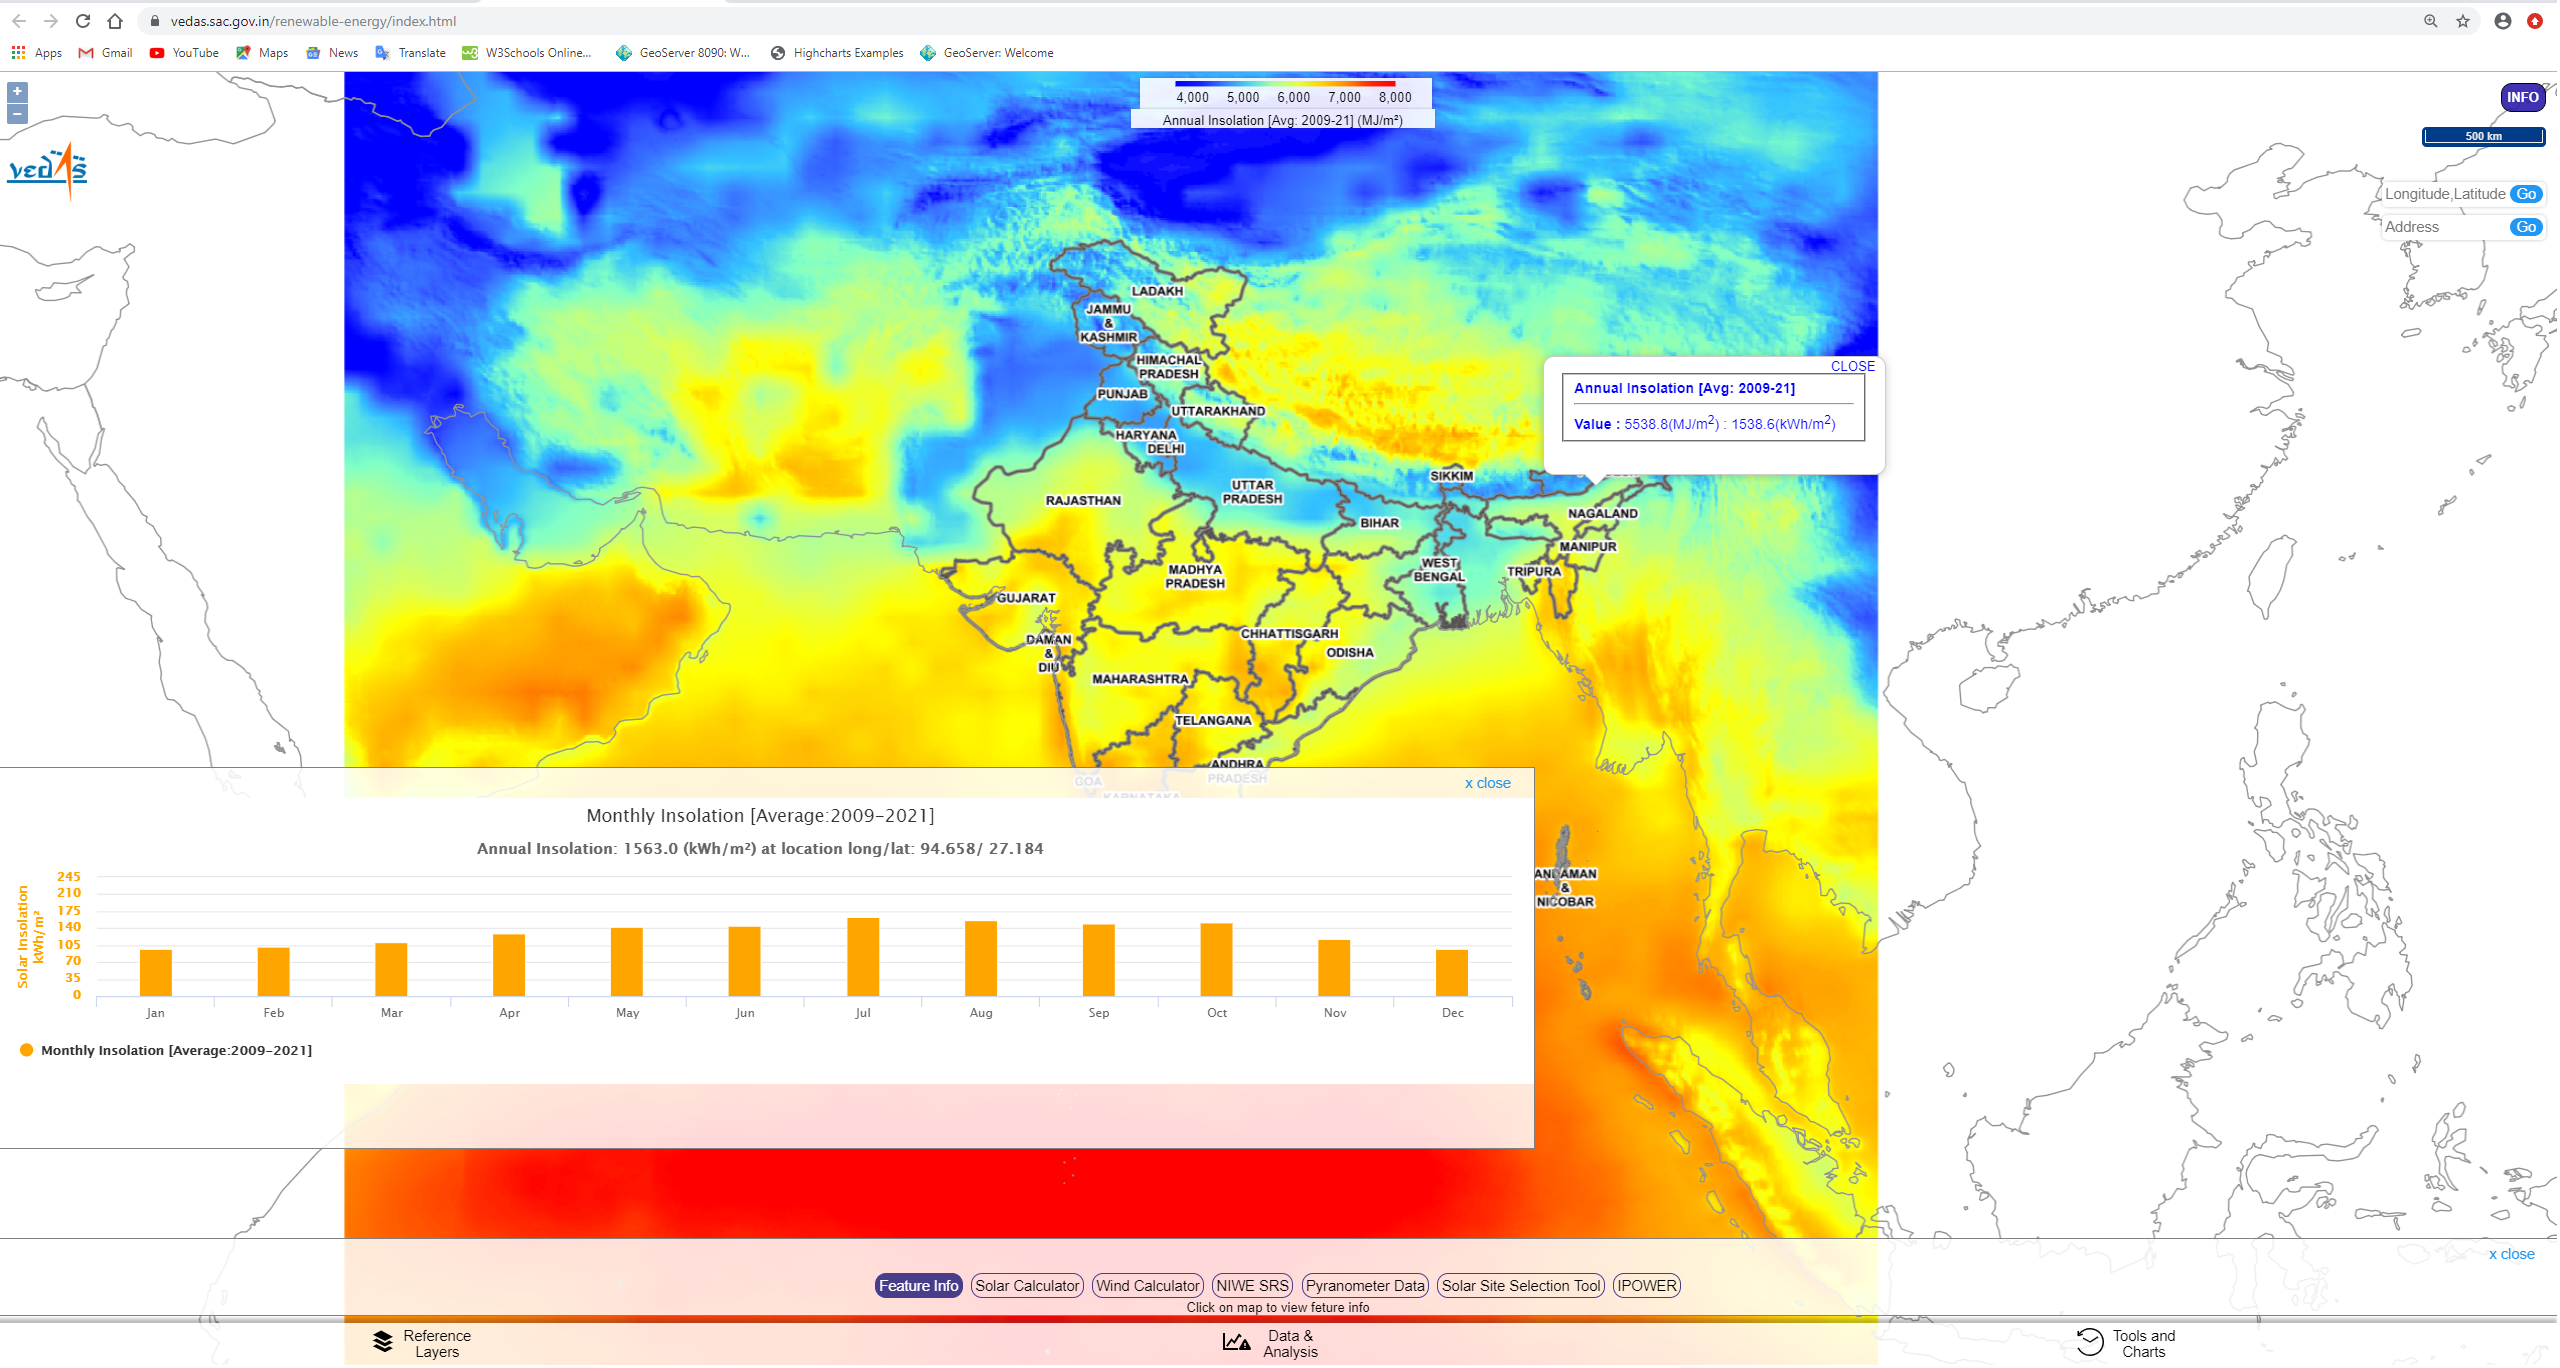
Figure 3.2: Feature Info in New and Renewable Energy - Solar Calculator Dashboard:
For any clicked location on map, Solar calculator provides information about long term monthly solar insolation and monthly temperature (maximum, minimum and average). It also include solar insolation and temperature long term profile and its year over year comparison, sun path, optimum tilt angle for solar panels, day length and power production of PV. Map is also provided to show user selected location along with overlay layers for value addition.
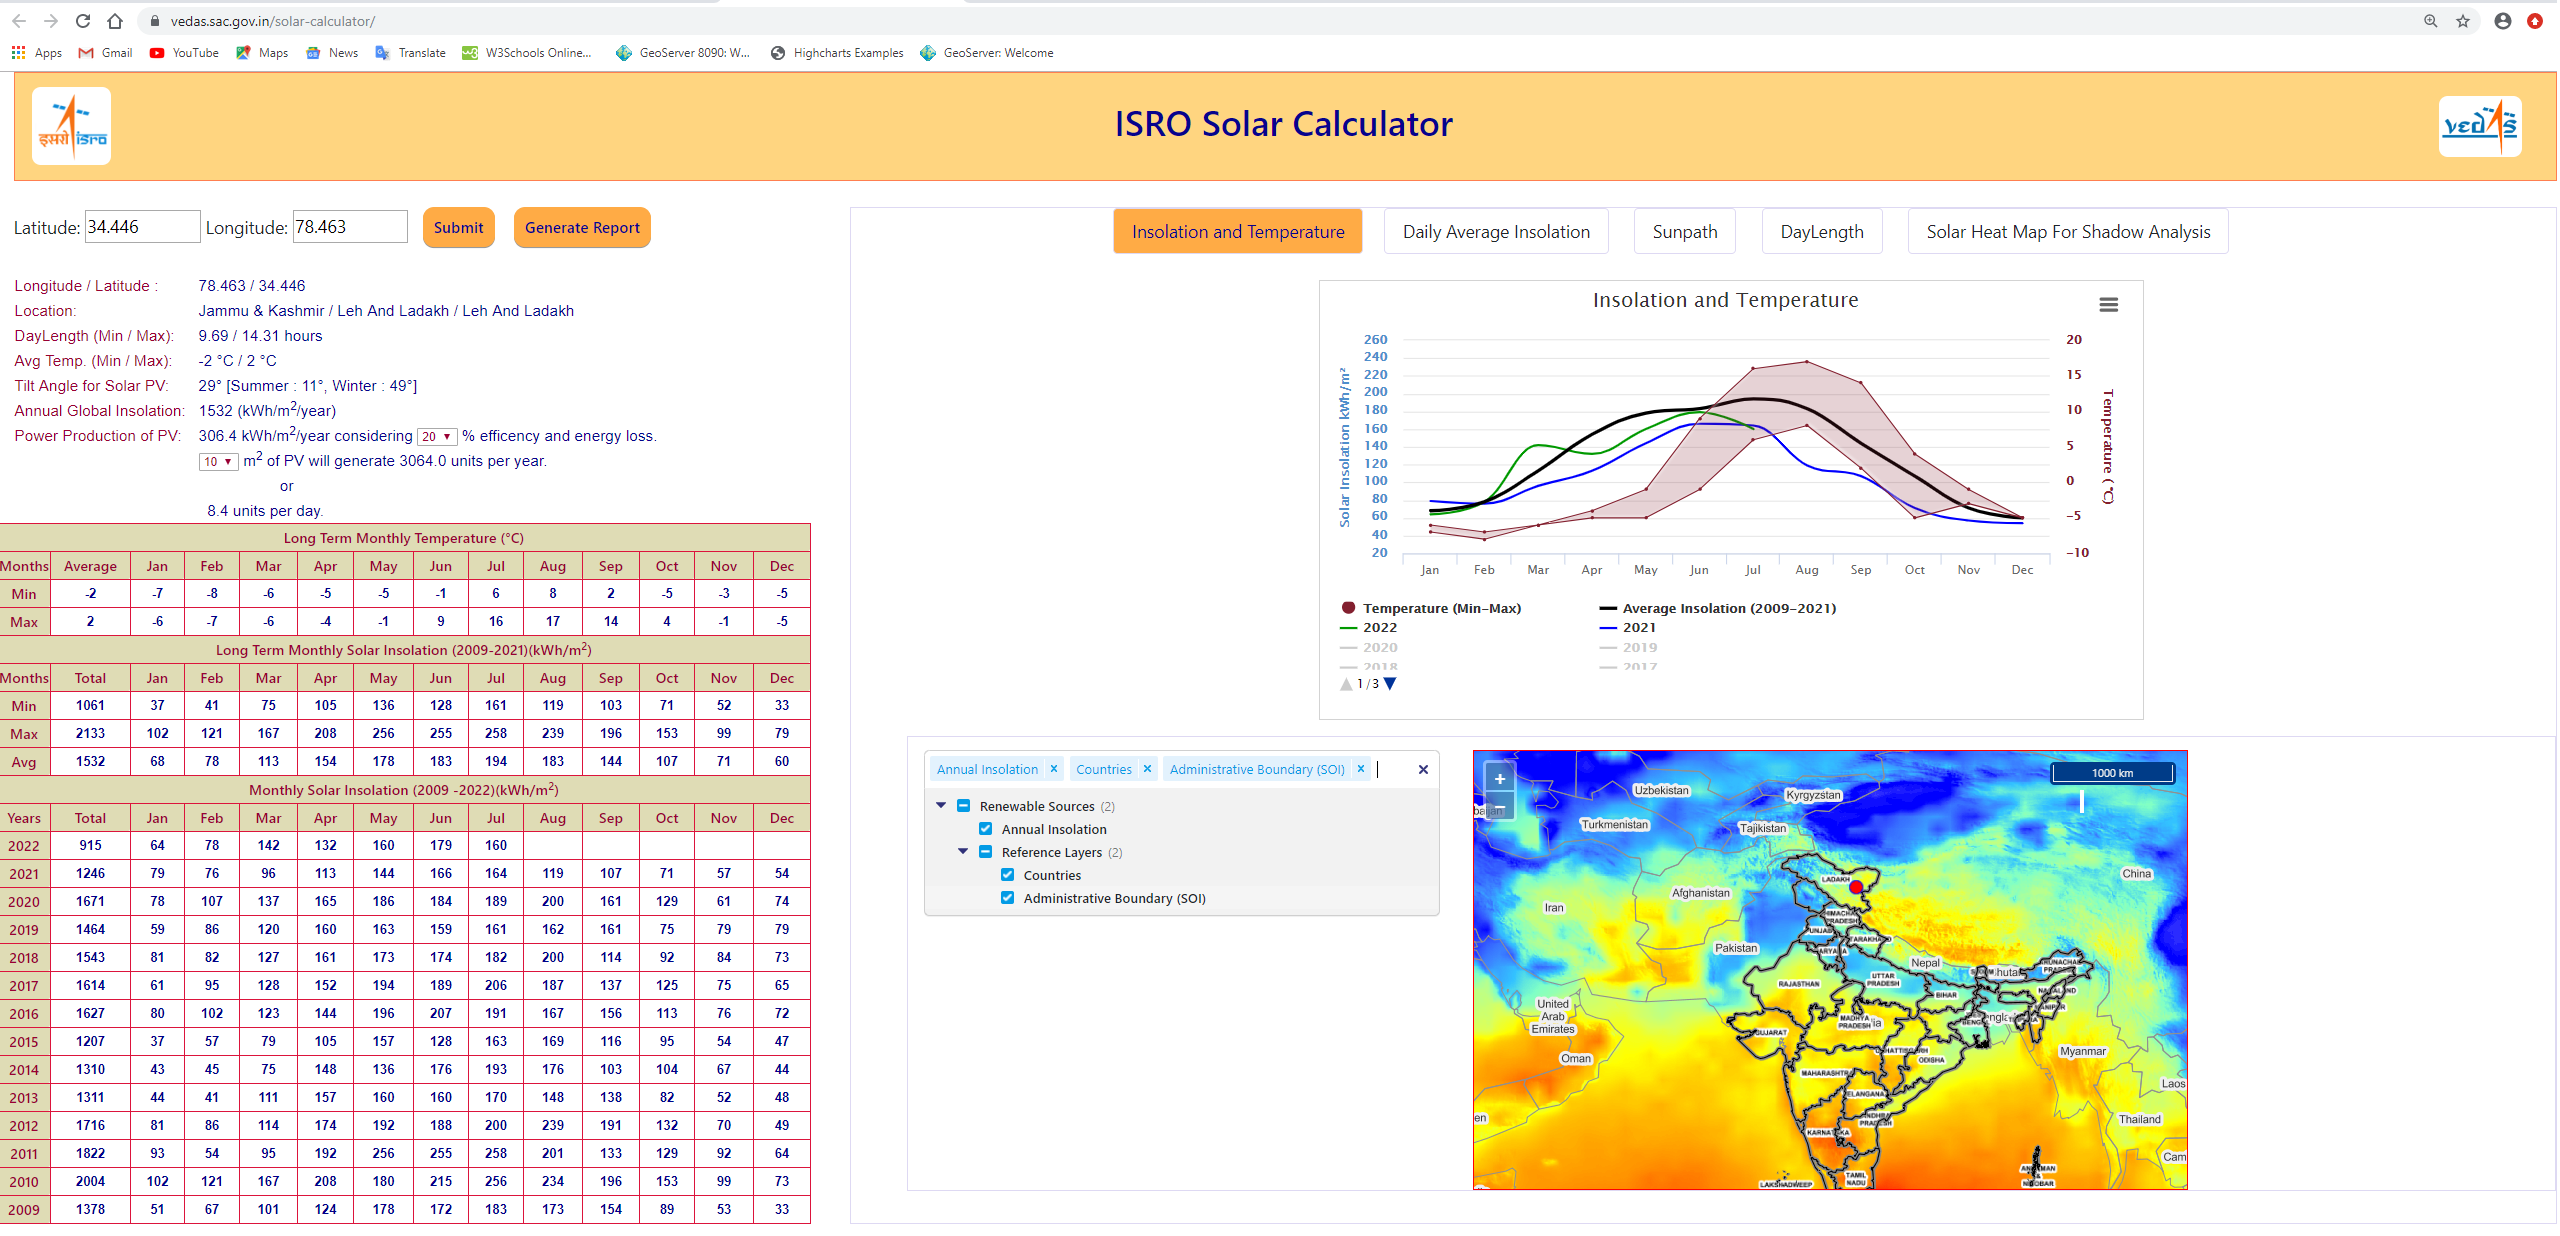
Figure 3.3: Solar Calculator Dashboard
Solar Calculator summary provides various Information like daylength min/max temperature,selected longitude/latitude, average temperature , tilt angle for Solar PV, Annual Global Insolation , Power Production of PV.
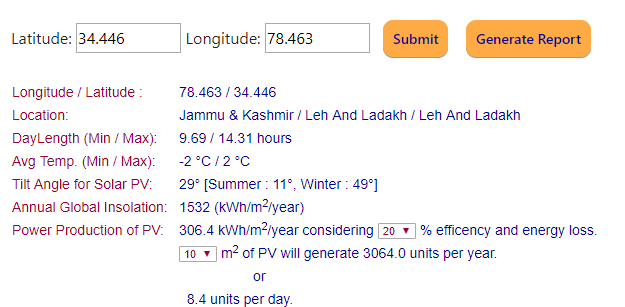
Figure 3.3.1: Solar Calculator Summary
Solar Calculator table provides long term monthly average temperature , Long term as well as current monthly solar insolation (2009-2021).
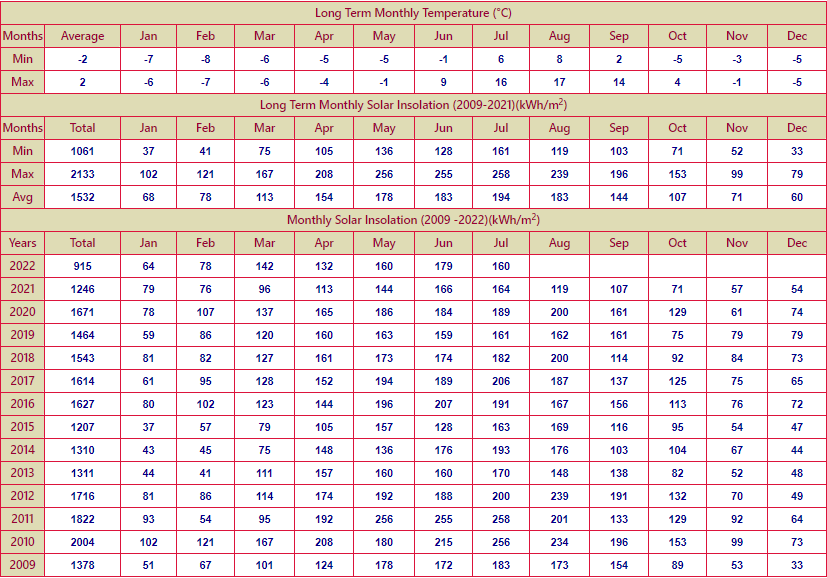
Figure 3.3.2: Solar Calculator Table
In the Chart Section, Solar Calculator provides Insolation and Temperature Profile, Daily Average Insolation(2014-2017),Sunpath, Daylength, Solar Heat Map for Shadow Analysis.
Insolation and Temperature
This chart provides 2009 onwards monthly solar insolation for year over year comparison and long term monthly average maximum/minimum temperature.
.png)
Figure 3.3.3: Insolation and Temperature Chart
Daily Average Solar Insolation (2014-2017) and Temperature.
The below chart shows Daily Average Solar Insolation (2014-2017) and Temperature.
.png)
Figure 3.3.4: Daily Average Solar Insolation (2014-2017) and Temperature.
Solar-Calculator Day-Length
It provides day length for a given latitude and day for the entire year.
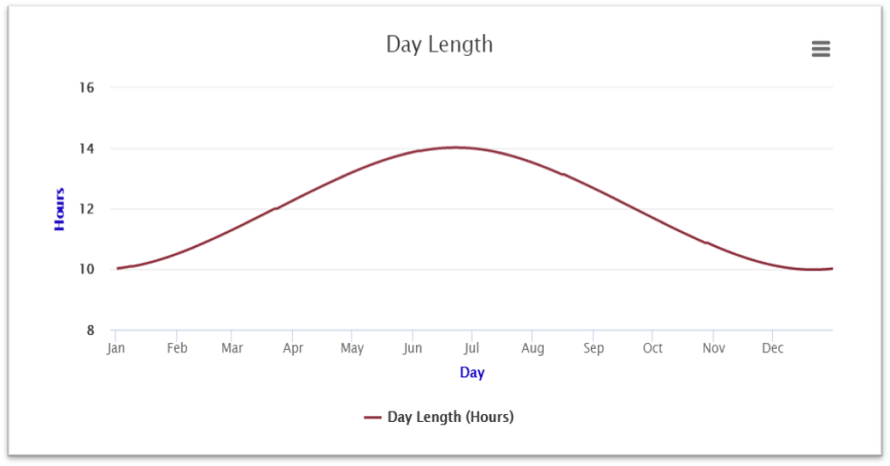
Figure 3.3.5: Day-Length Solar-Calculator SunPath
Sun's position in the sky for each location (latitude) on the earth at any time of day, using Cartesian coordinates. Sunrise and sunset time is also calculated. 21 Jun Solstice - the longest day of the year 21 Dec Solstice - the smallest day of the year 21 Mar/Sep Equinox - day and night of equal length.
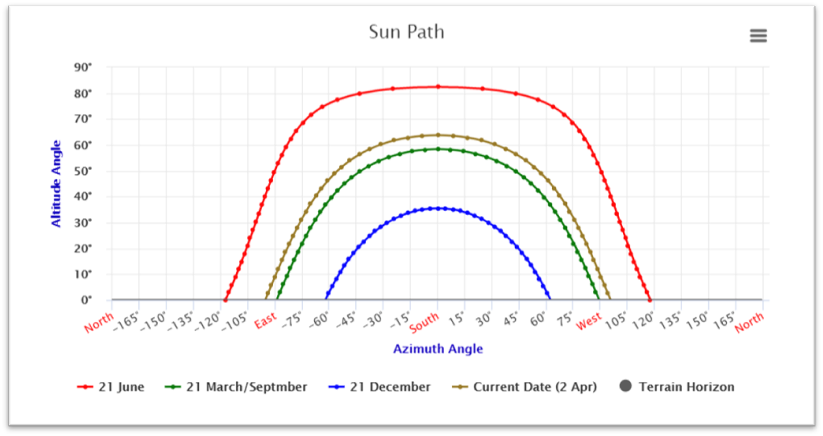
Figure 3.3.6: SunPath
Solar Heat Map for Shadow Analysis
This Heat Map shows duration for which the solar energy will be available without any shadow due to terrain. Black Color shows the shadowed time. Green color shows the time during which solar energy is available. This is available during all days in the years. This is calculated using Cartosat Digital Elevation Model (DEM 10m) .
.png)
Figure 3.3.7: Solar Heat Map for Shadow Analysis
Map
User selected location is shown on map along with administrative boundary and high resolution satellite imagery. Marker shows the location provided by user.
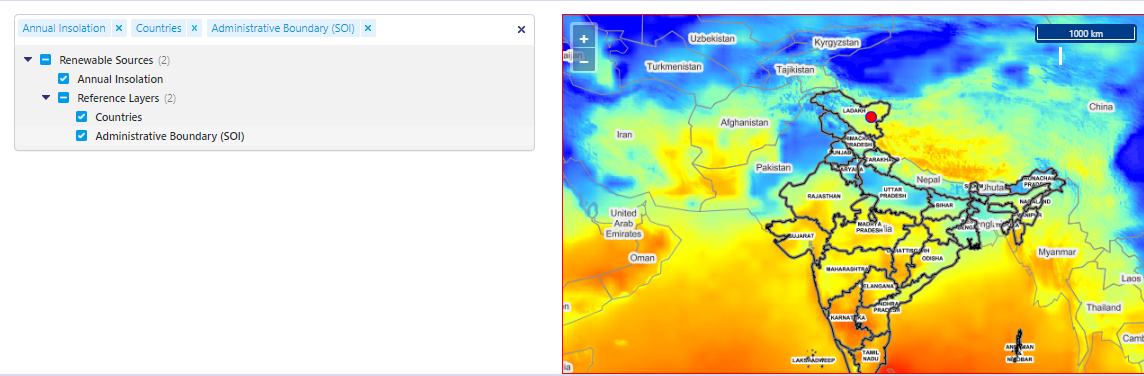
Figure 3.3.8: Solar Calculator Map
- Wind Calculator :
Wind Calculator provides information on montlhy wind speed, wind power and wind direction in tabular and graphical formats for selected location by user.
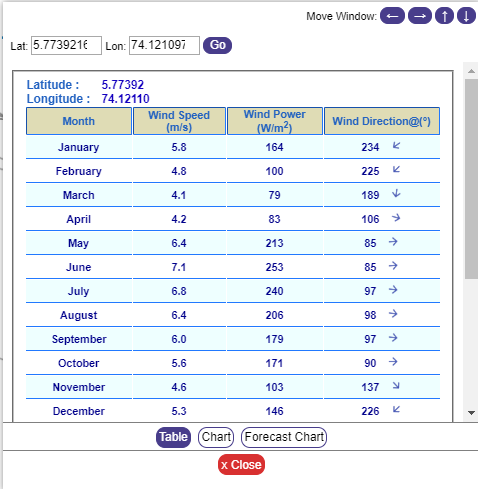
Figure 3.4.1: Wind Table 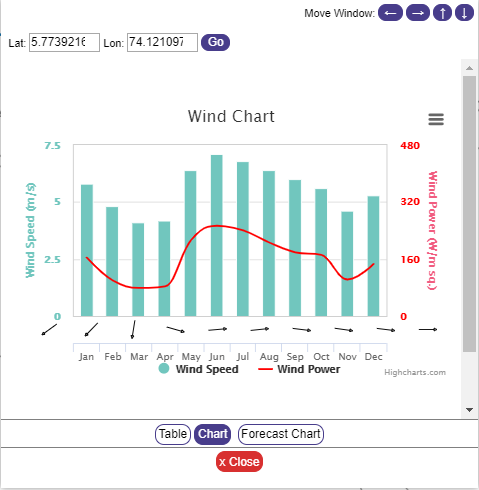
Figure 3.4.2: Wind Chart
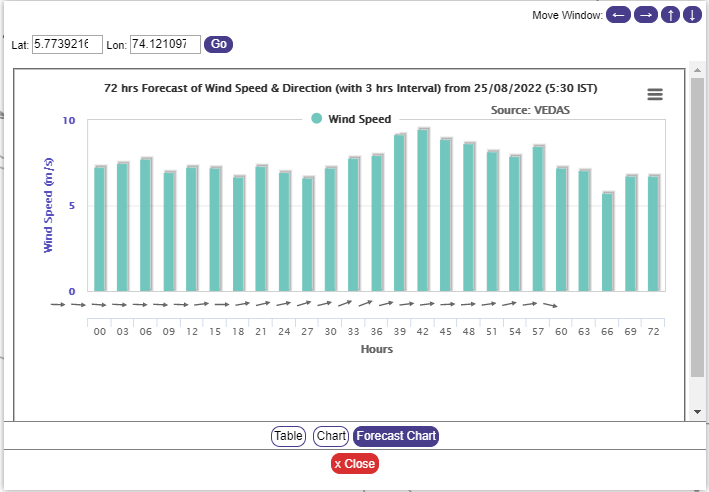
Figure 3.4.3: 72hrs Forecast of Wind & Direction - NIWE Gandhinagar SRS Data Dissemination
National Institute of Wind Energy (NIWE) under Ministry of New and Renewable Energy (MNRE) has provided Global Horizontal Irradiance (GHI), Air Temperature data of Gandhinagar Solar Research Station (SRS) for year 2017 (every minute). Development is done for organizing GHI, Maximum and minimum temperature at hourly, daily and monthly interval in relational database. Same data is visualized and screenshots are given below:
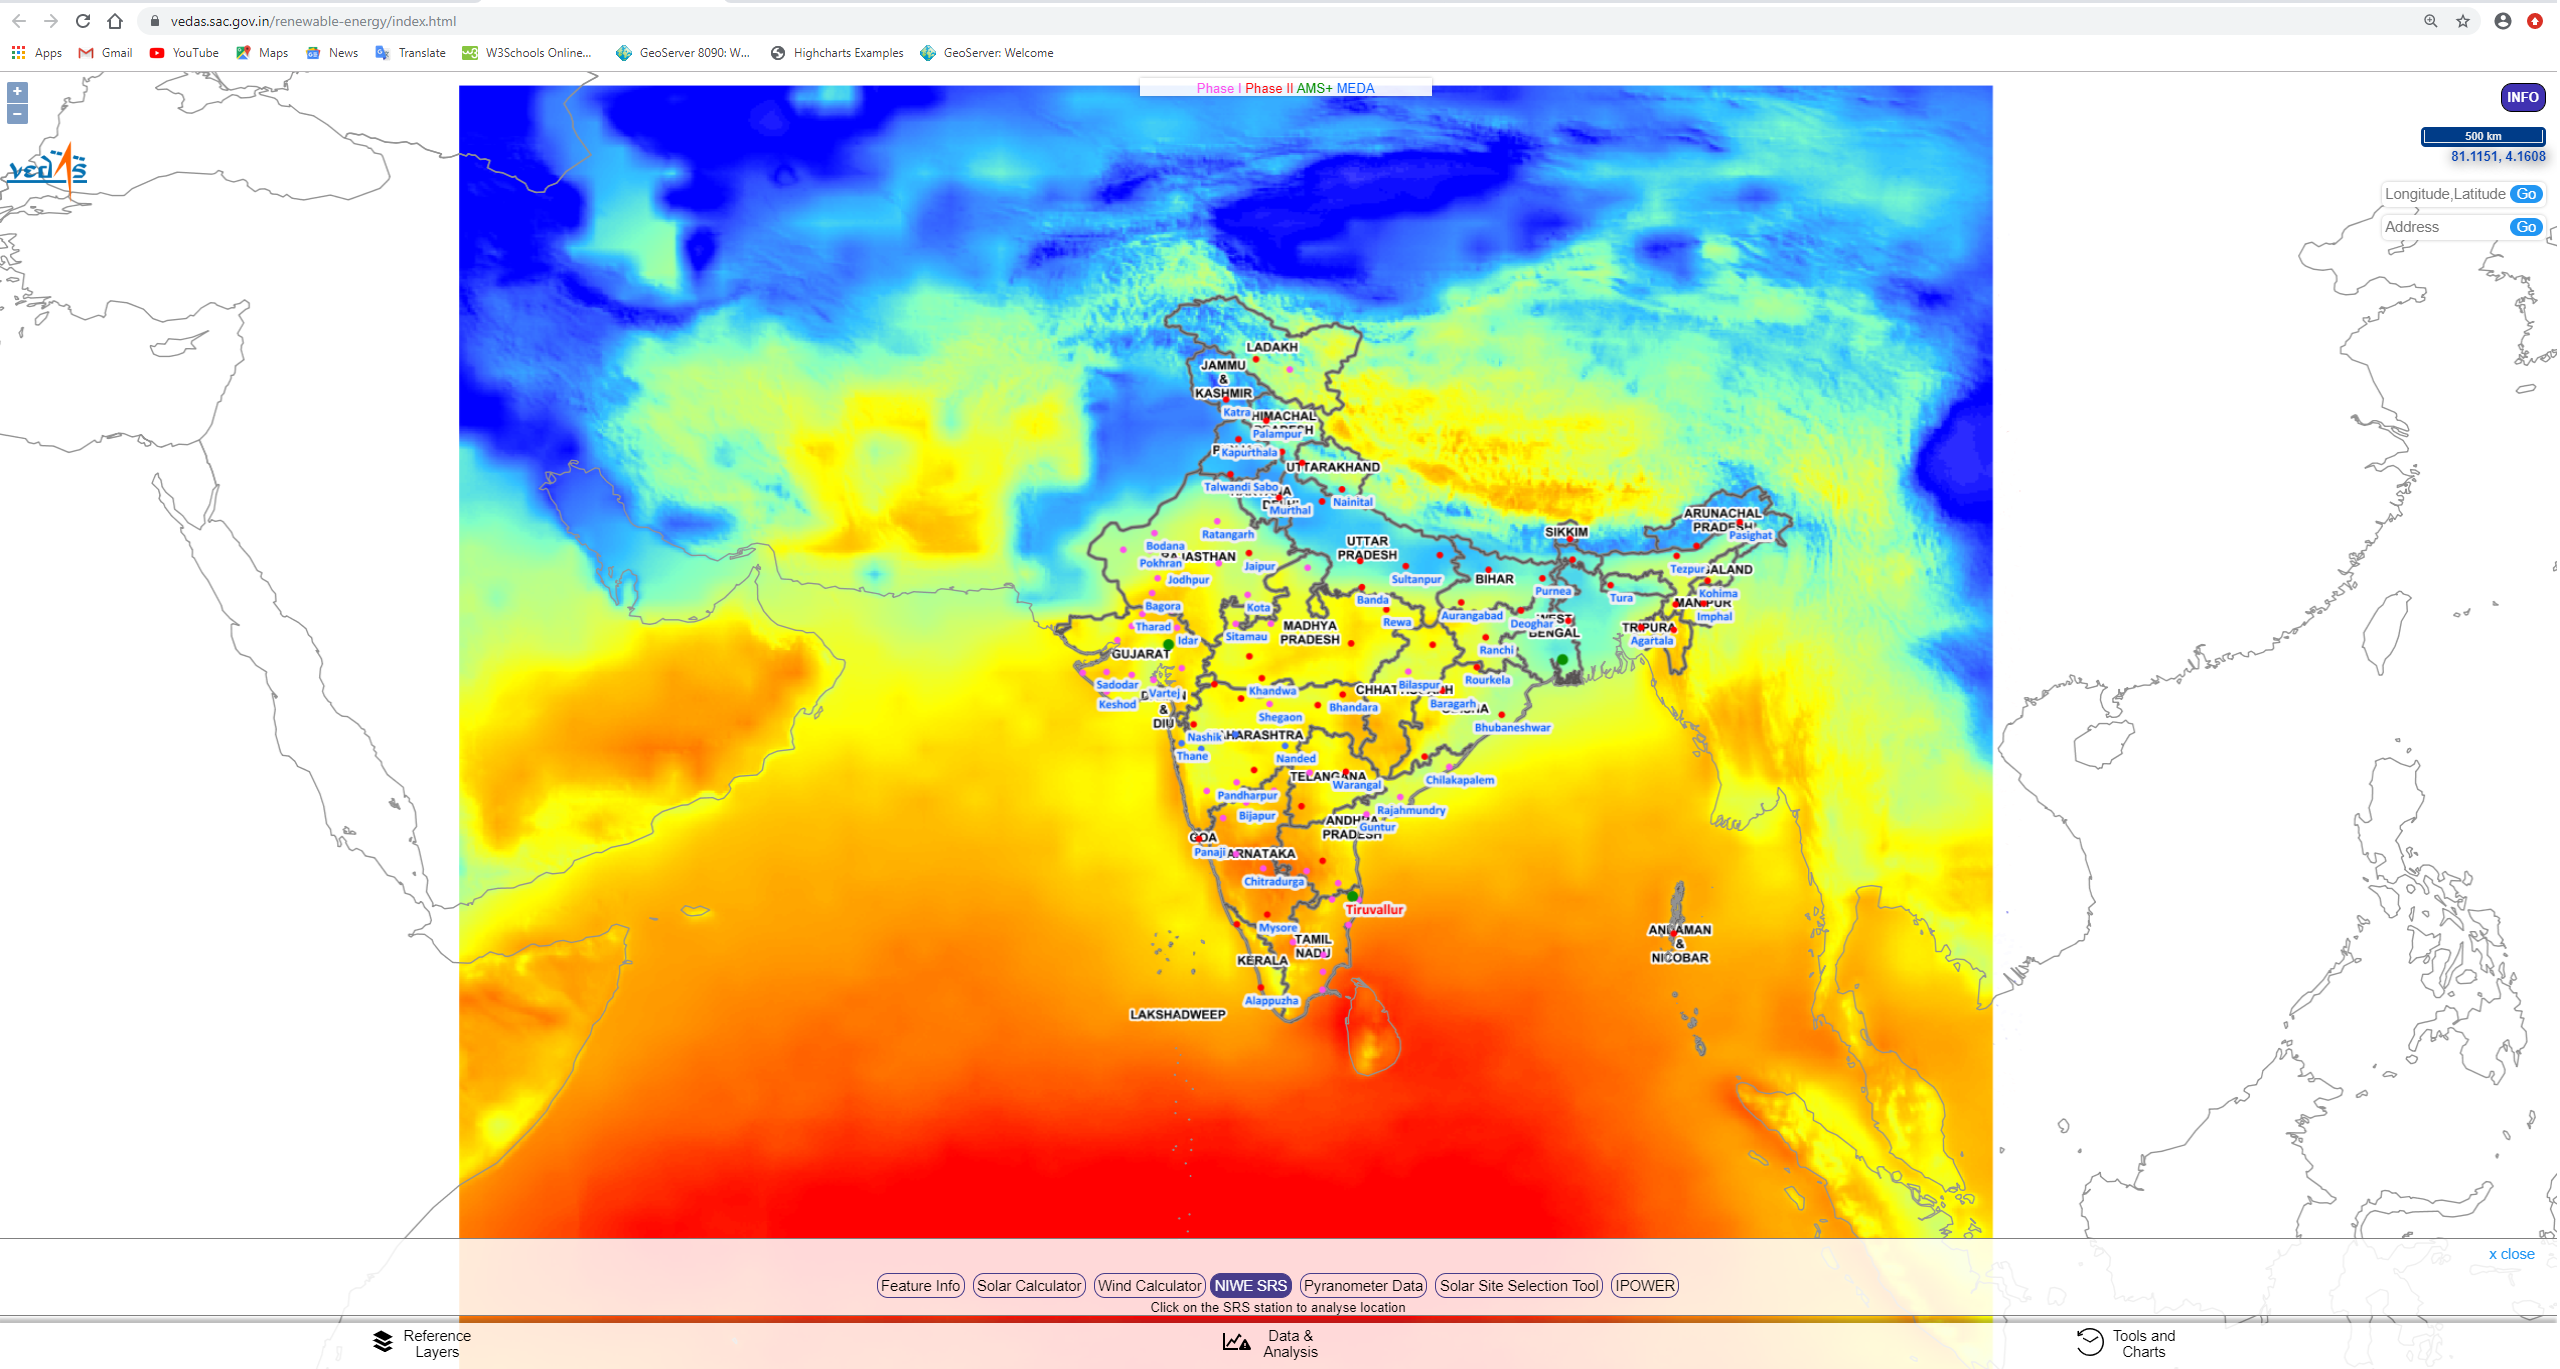
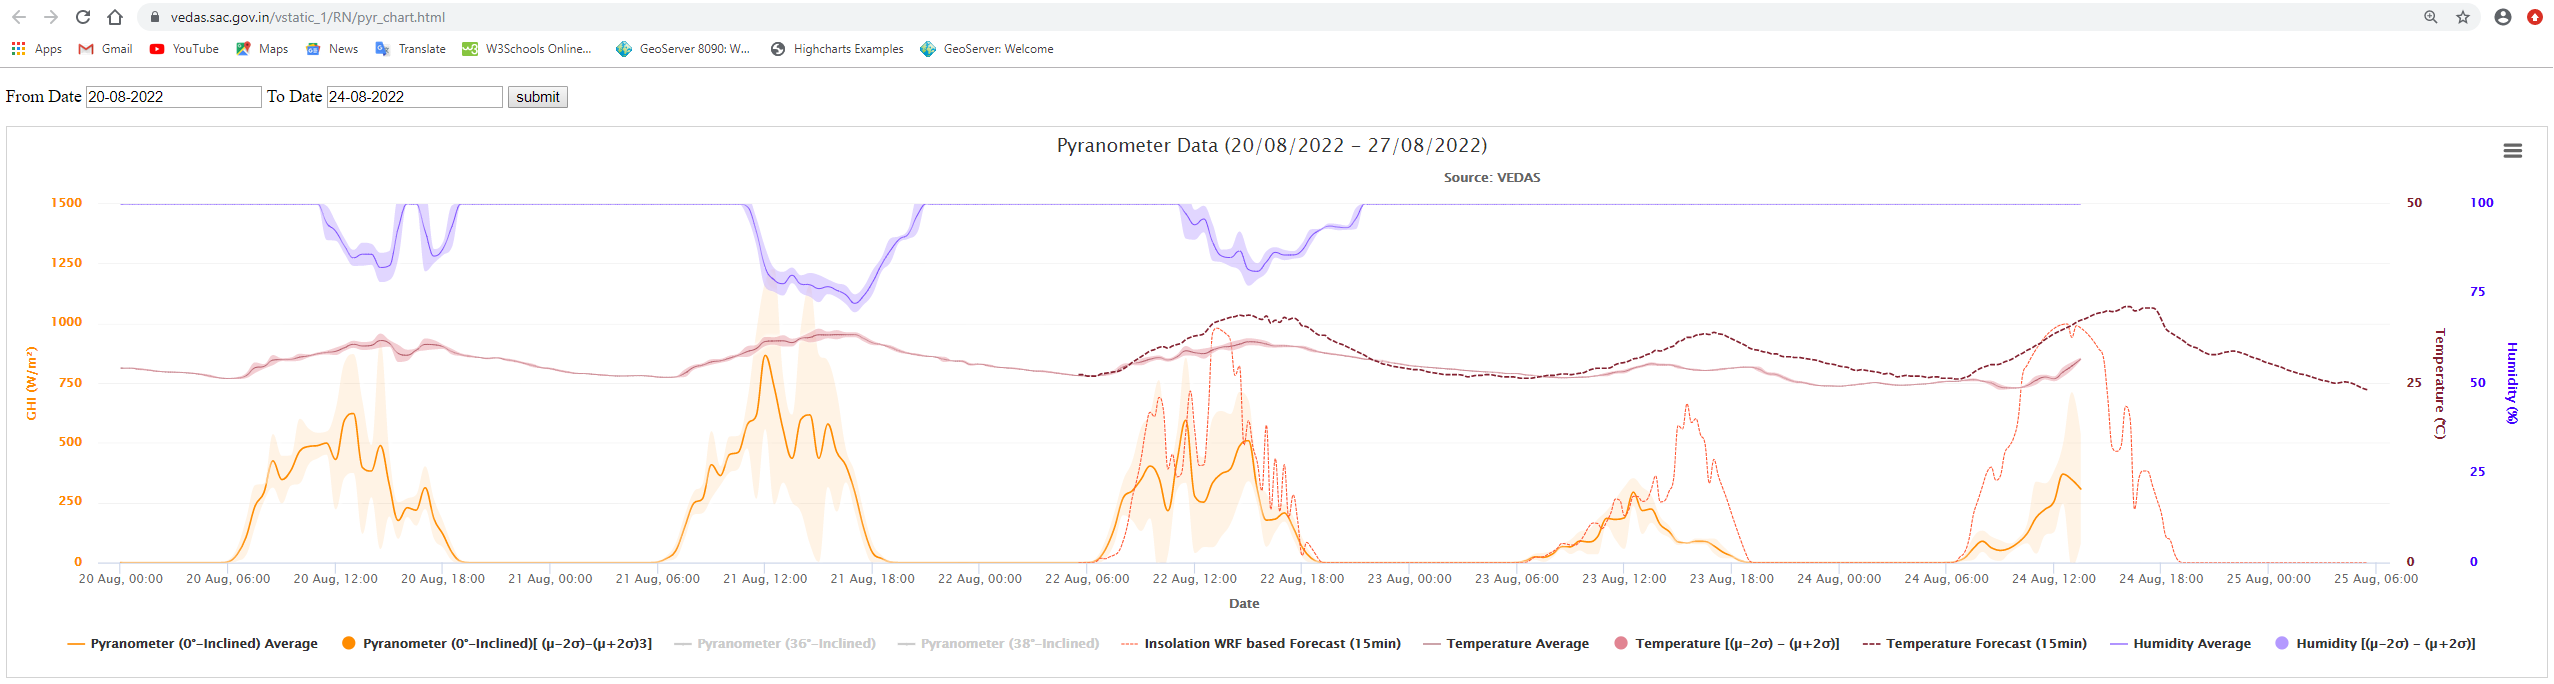
Figure 3.5:NIWE SRS - Pyranometer Data
Pyranometer is an instrument to measures solar radiation on a unit area horizontal surface from all directions. Pyranometer instrument along with Temperature and Relative Humidity (RH) sensor are installed at SAC Bopal Campus (Technical) with longitude and latitude values of 72.45576, 23.04166 degree for scientific study. User Interface is developed to visualise current as well as previous GHI, temperature and RH at installed location in graphical format. Next 72 hours (15 min interval) WRF based solar insolation and temperature forecast is also visualized and daily updated for comparative analysis.
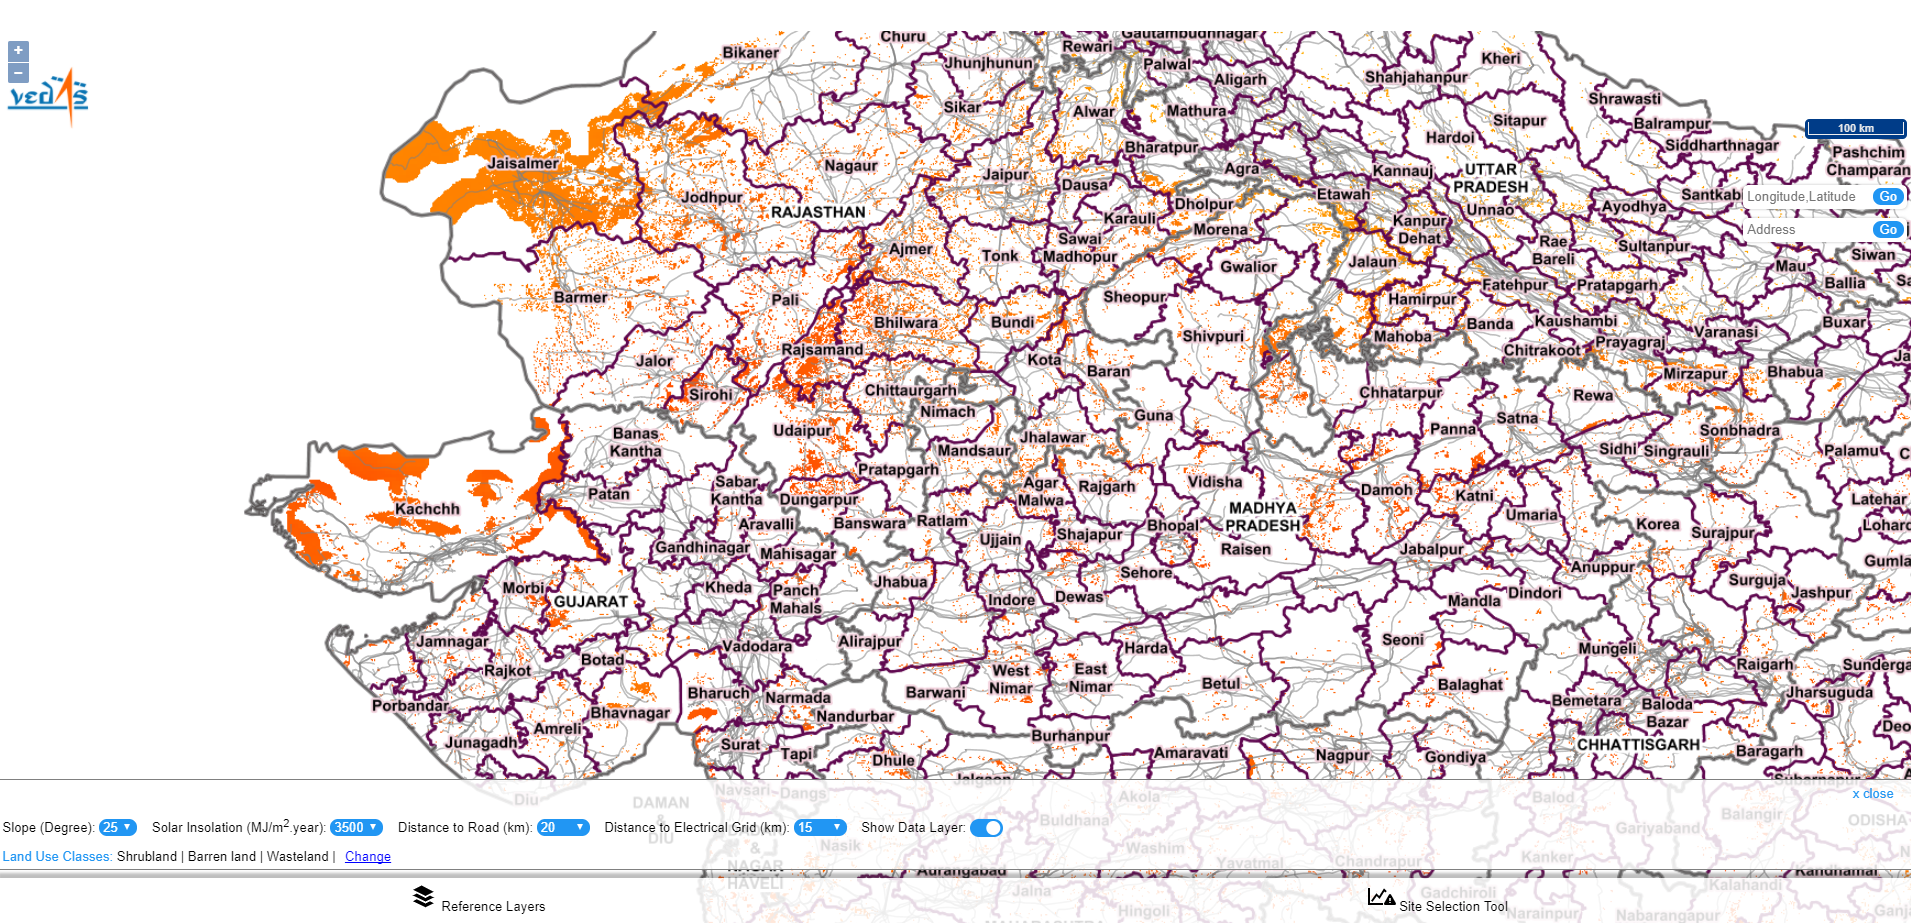
- Solar Site Selection Tool
Solar Site Selection tool is an interactive visualisation tool which shows area suitable satisfying user criteria for installing solar power plants / solar panels based on following parameters : (i) Solar Insolation (ii) Landuse (iii) Slope (iv) Distance from road (v) Distance from grid network.
- IPower
IPower application provides information about potential offshore Wind Energy Resources
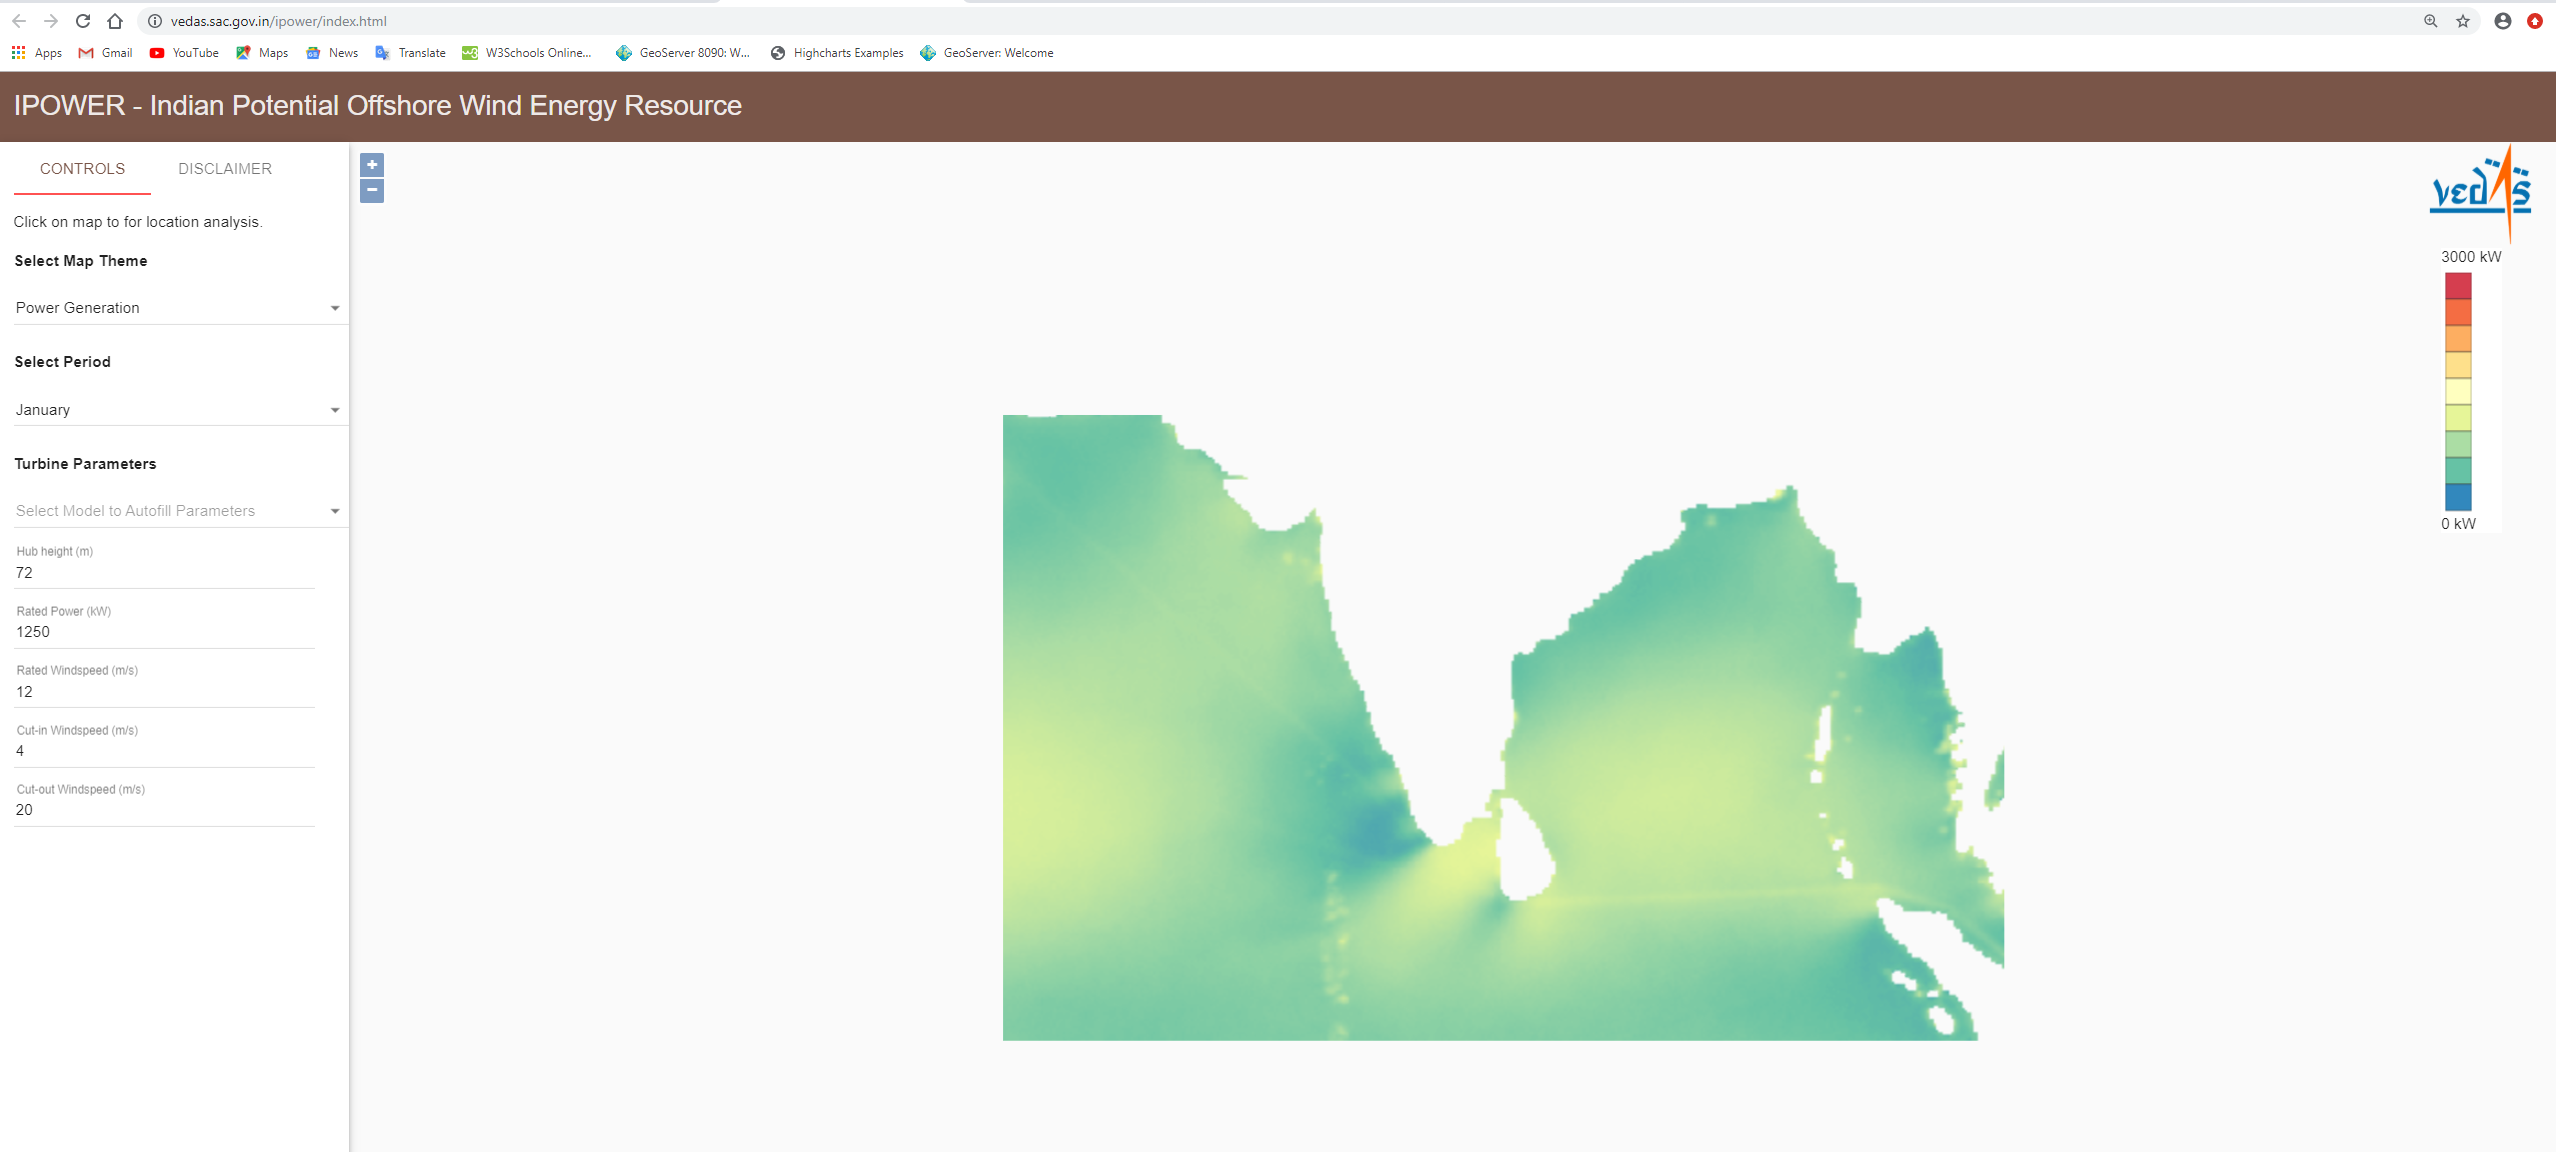
Figure 3.8: IPower
Introduction
New and Renewable Energy Application developed under VEDAS using WebGIS based technology provides information on monthly/yearly solar and wind energy potential along with related parameters. Such information is required for locating potential sites for extracting / tapping New and Renewable Energy resources. Solar Calculator Mobile app is developed to assess solar energy potential (2009 onwards) estimated from Indian remote sensing satellites INSAT 3D/3DR in tabular and graphical formats inclusing monthly insolationand temperature profile, sunshine hours, day length, and sun path for location provided by the user. The user provides a location in the form of geographical co-ordinates by keying in or clicking on the. It provides information in tabular and graphical format and interactive web maps Developed solar site selection tool facilitates a potential user for identifying suitable sites for installing solar power plants. Application is provided with three tabs shown in bottom and map area for geosatial data visualisation anad analysis. Tabs include: