


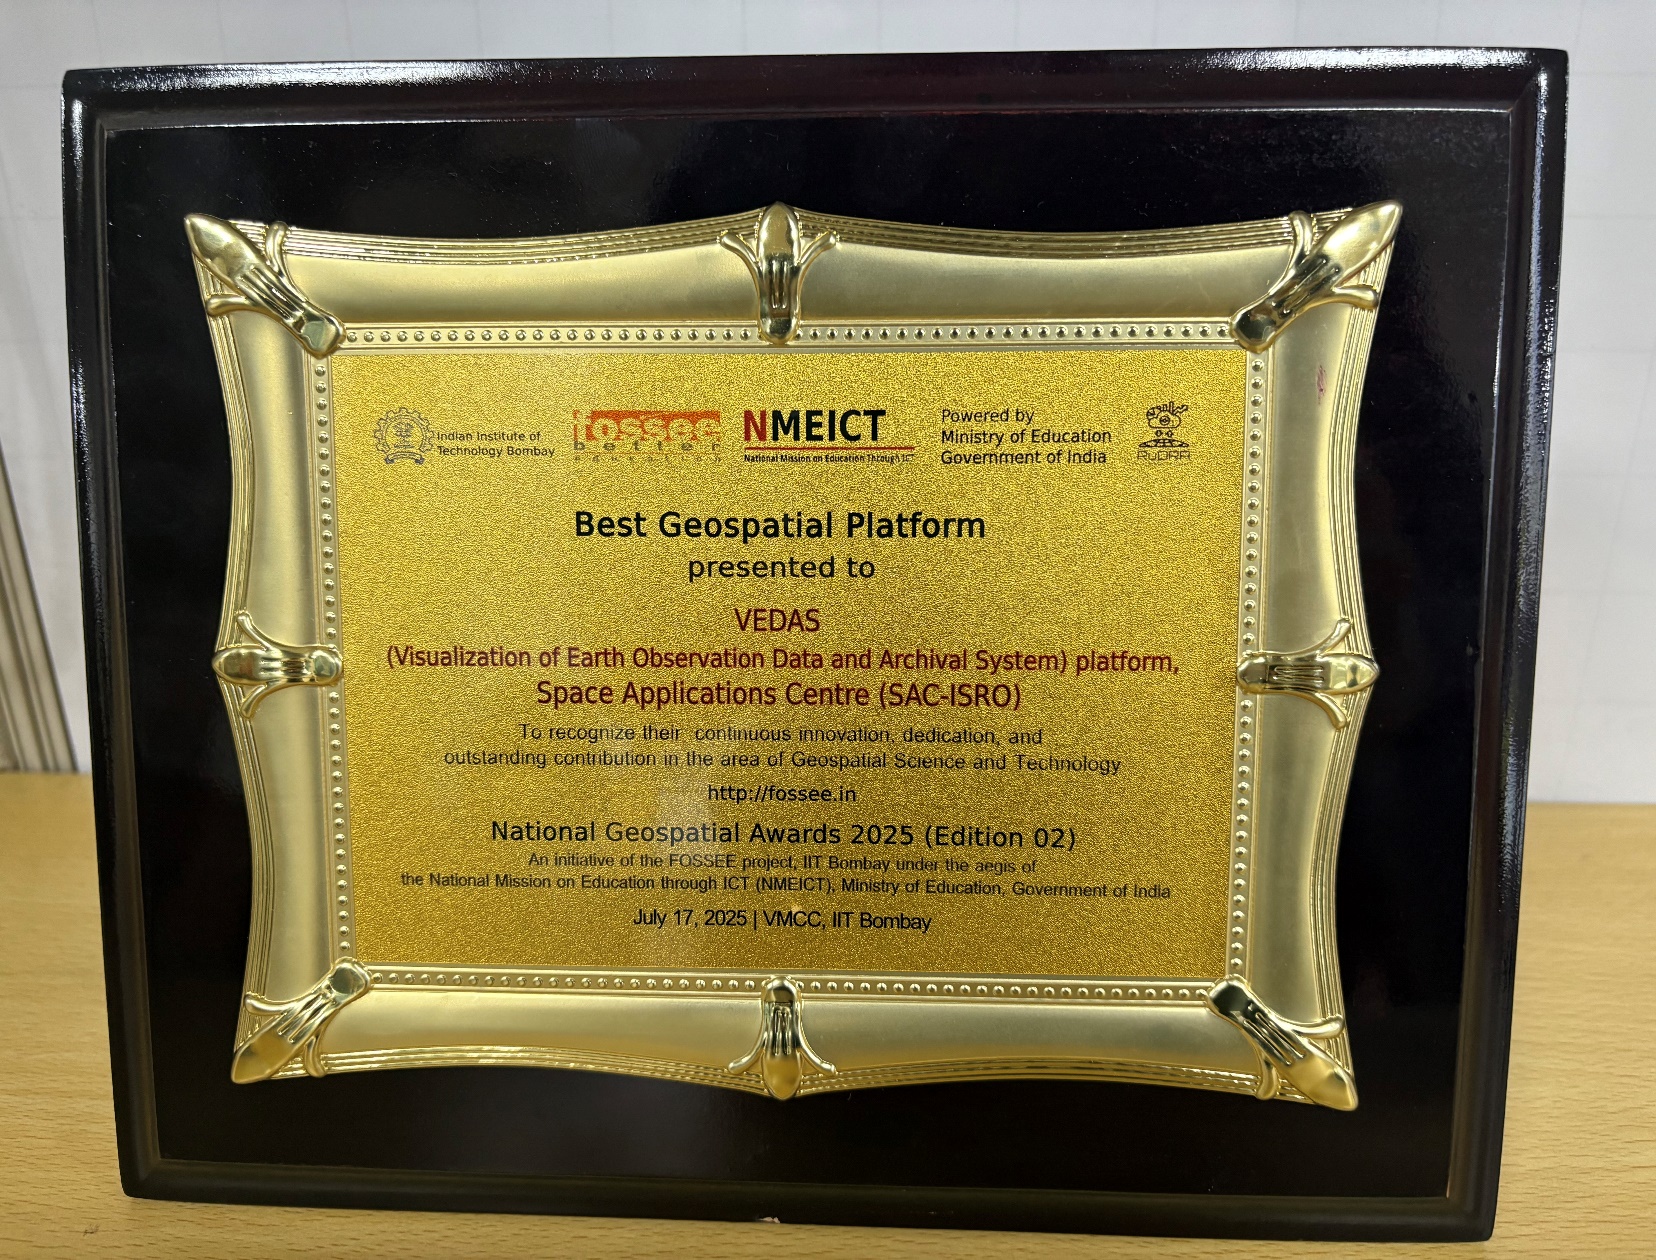
VEDAS received the “Best Geospatial Platform (National Jury Award)” by FOSSEE GIS, IIT Mumbai
|
Space Applications Centre, ISRO honoured with four awards at National Geospatial Awards 2025 (Edition II), organized by IIT
Bombay’s FOSSEE GIS team under the aegis of the National Mission on Education through ICT (NMEICT),
Ministry of Education, Government of India. The awards were conferred during the Open Source
GIS Day 2025 celebrations held at IIT Bombay on 17th July 2025, in the august presence of Shri
A. S. Kiran Kumar, Former Chairman, ISRO. |
|
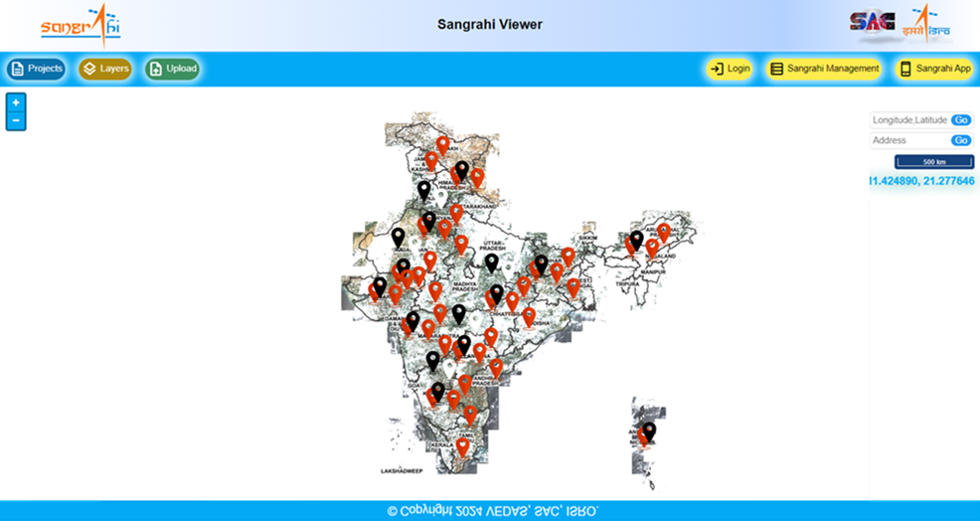
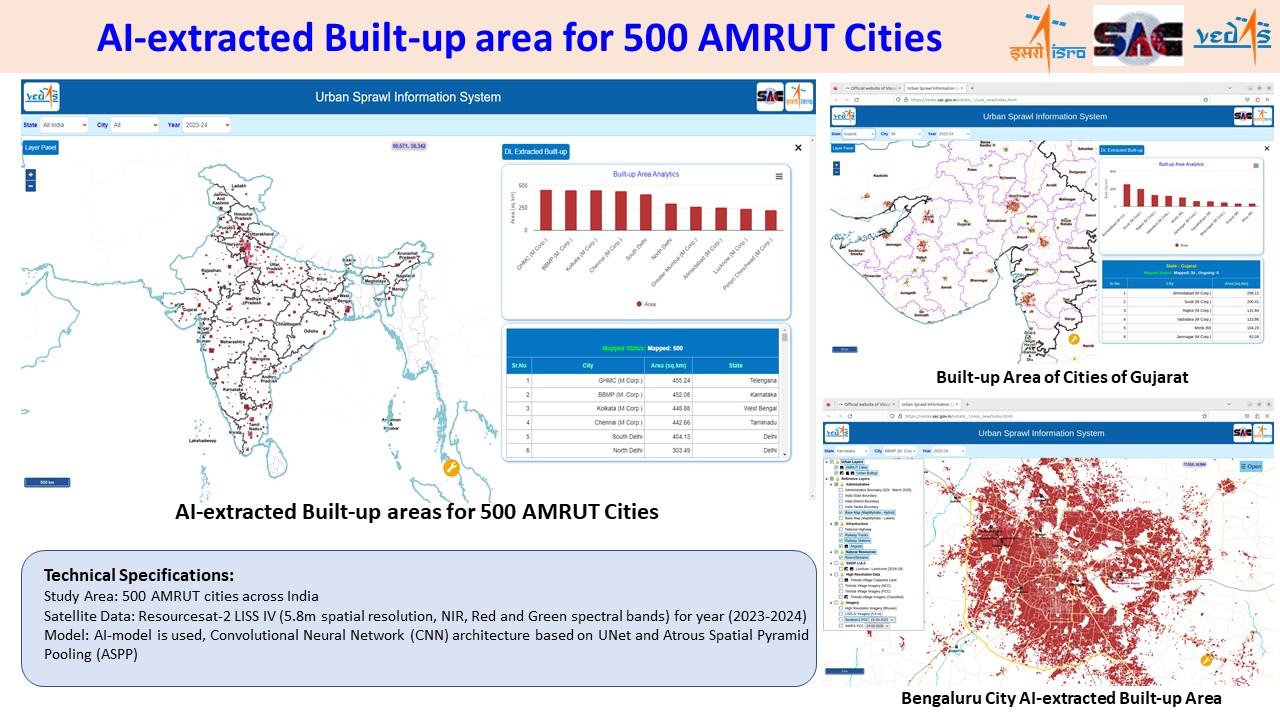
AI-Extracted Built-up Area for 500 AMRUT cities
|
Built-up area serves as an important indicator of socio-economic growth of a country. Several studies require built-up area for quantifying anthropogenic impacts on environment and climate change. The built-up surfaces are very dynamic and therefore require regular monitoring. The 5.8 m spatial resolution of Resourcesat-2/2A LISS-4 sensor is not only suitable for mapping core urban areas, but is also effective in capturing small scattered growth in urban periphery. The built-up area of 500 cities of India (identified under AMRUT programme) was extracted from Resourcesat-2 LISS-IV data for 2023-2024 timeframe using Artificial Intelligence (AI). The AI-model uses Convolutional Neural Network (CNN) architecture based on UNet and Atrous Spatial Pyramid Pooling (ASPP) concept. A web-based application on VEDAS portal was created to enable visualisation and analysis of built-up area. It enables state and national level comparison of built-up area of cities. |
|
Webinar on VEDAS API Centre
|
A collaborative webinar on the VEDAS API Centre was conducted by the Space Applications Centre (SAC) and Indian National Space Promotion and Authorization Center (InSpace) to engage with private industry stakeholders. The session aimed to introduce the capabilities of VEDAS (Visualization of Earth Observation Data and Archival System) and its API services, fostering industry participation in space-based applications. The event featured insightful keynote addresses from distinguished leaders in the space sector: Shri Nilesh M. Desai, Director, SAC, highlighted the significance of Earth observation data in various sectors and how VEDAS can empower industry professionals with advanced analytical tools. Dr. Vinod Kumar, Director, PD, InSpace, emphasized the role of private industry in leveraging VEDAS API for innovation and commercial applications. Dr. Rashmi Sharma, Deputy Director, EPSA/SAC, provided an overview of SAC’s vision for enabling geospatial intelligence and industry collaboration. The webinar included a series of technical presentations by experts from SAC, elaborating on the functionalities and applications of VEDAS and the VEDAS API Centre. Shri Shashikant Sharma, Group Director, GAWG/EPSA provided a demo of VEDAS applications, showcasing its practical usage across different domains. Shri Pankaj Bodani, Deputy Head, VWAD/GAWG, discussed the VEDAS API Centre, its applications, available APIs and the future scope of the platform. Shri Arpit Agarwal, Scientist, VWAD, gave a step-by-step demo for registering on the platform and creating a first key to use the API services. The webinar concluded with an engaging Q&A session, where participants had the opportunity to seek clarifications and explore potential collaborations. Experts addressed queries regarding API access, data formats, application domains, and industry partnerships. With more than 150 participants from various private industries, the webinar marked a significant step toward strengthening industry-academia collaboration in the geospatial and space-tech sectors. The event provided a platform for stakeholders to understand the capabilities of VEDAS and explore its potential in domains such as agriculture, urban planning, disaster management, and environmental monitoring. The successful execution of this webinar underscores SAC and InSpace’s commitment to fostering innovation, promoting industry participation, and advancing India’s space ecosystem through cutting-edge geospatial solutions. Click here to go to API Centre |

|
INterferometric SAR Data Analysis and Usage Software (INDUS)
|
INterferometric SAR Data Analysis and Usage Software (INDUS) is a SAC developed software for interferometric analysis of SAR datasets. INDUS is a self-sufficient, portable and containerized software developed in C++ and Python. All the required libraries are available in the container and can be run by any software capable to load the container. The software is capable of generating the deformation map as well as the relative elevation map. It also generates the coherence map that can be used for various change detection analysis. Currently, this software caters to interferometric analysis of ISRO EOS-04 SAR mission. Support to upcoming missions like EOS-09 and NISAR will be extended in the software for interferometric analysis. Click here to download user manual (PDF Size:1.3MB Language: English) Click here to download INDUS Software (ZIP Size: 2.75GB Language: English) |
")
|
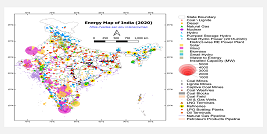
AI based Solar power plants extraction for Indian states from Resourcesat LISS IV data
|
Solar power plants are extracted for ten Indian states (Haryana, Punjab, Gujarat, Madhya Pradesh, Rajasthan, Maharashtra, Karnataka, Telangana, Andhra Pradesh and Tamil Nadu). Combined installed capacity of solar power for these states is 81.87GW which is about is 90.2% of India's total solar capacity (90.76GW) . Automatic extraction of these Solar power plants are done using artificial intelligence based deep learning neural networks for the year (Jan-April) 2023. Indian Remote sensing (IRS) Resourcesat-2A LISS IV satellite data is used with 5m ground spatial resolution and three spectral bands green, red and NIR. The study also includes temporal change analysis of Solar Plants from 2018 till 2023. It is found that in the past five years solar power plants inventories have increased nearly 6.3 times in Rajasthan, 2.5 times in Gujarat, 1.5 times in Madhya Pradesh, 1.57 times in Maharashtra, 1.25 times in Karnataka, 0.3 times in Telangana, 1.87 times in Andhra Pradesh and 2.31 times in Tamil Nadu. This work is carried out under TDP- 202302021, titled “Deep learning Based Solar Plants Identification using high-resolution remote sensing data”. Click here to go to New and Renewable Energy Click here to Know more (PDF Size:1.20MB Language: English) |

|
NWIA - High resolution Remote Sensing Assessment and Analysis
|
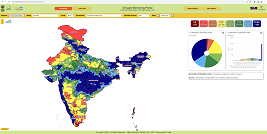
India is blessed with an enormous diversity of wetland ecosystems which play a critical role in regulating carbon and hydrological cycles, resilience in climate change and land degradation, water related disasters, nutrient cycling, local economy etc. The concern for conservation and management of wetlands is increasing all over the world including India, due to increasing population pressure and developmental activities. Space Applications Centre, ISRO has generated National wetlands geospatial dataset using multi-date and multi-seasonal Resourcesat-2/2A LISS-IV datasets of 5m spatial resolution (approx. 4000 scenes). A wetland classification system based on IUCN/RAMSAR definition and amenability on remotely sensed data was used to classify the wetlands. Total twenty types of wetlands were mapped. Nation-wide mapping of wetlands at 1:10000 scale provides current status of wetlands, its type, extent, area, perimeter, location, distribution etc. Total wetland area estimated is 16.89 Mha, which is around 5.12 % of the total geographic area of the country. A total of 3.58 Million wetlands in number with 2.49 Million wetlands (area >= 0.1 ha) as polygon features and another 1.09 Million wetlands (< 0.1 ha) as point features have been mapped. Wetlands statistics along with geospatial analysis is being brought out in the form of an atlas. This National wetlands work is done under SARITA (SAtellite based RIver basin hydrological Techniques and Application) programme with the support of state remote sensing centres and various academic institutions. For more details about the geospatial data please visit (https://vedas.sac.gov.in/wetlands/index.html). Click here to Visualise Wetlands Click here to Download Atlas (PDF Size:709MB Language: English) |

|

")
")
