




|
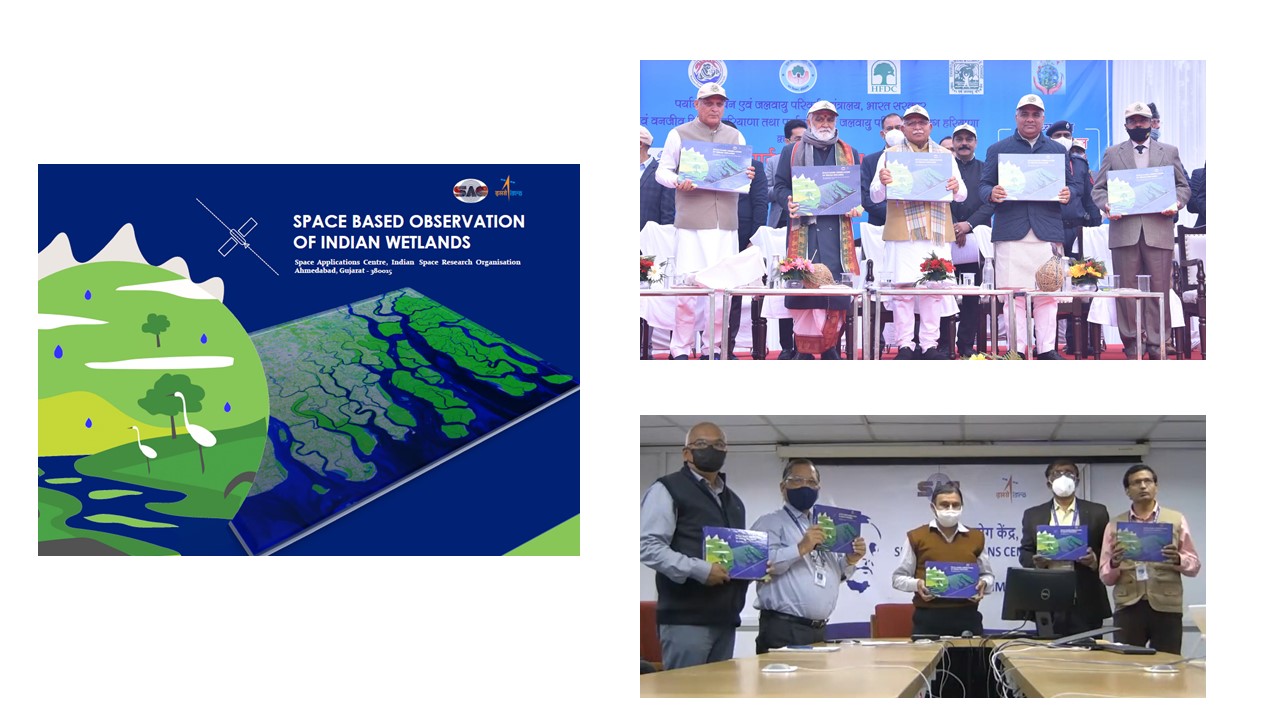
India is blessed with an enormous diversity of wetland ecosystems which play a critical role in regulating carbon and hydrological cycles, resilience in climate change and land degradation, water related disasters, nutrient cycling, local economy etc. The concern for conservation and management of wetlands is increasing all over the world including India, due to burgeoning population pressure and developmental activities. Therefore, Space Applications Centre has carried out National wetland inventory and assessment-2nd cycle under SARITA (SAtellite based RIver hydrological Techniques and Application) programme of SAC, funded by Department of Space. This National wetland geo-database is developed using multi-date Resourcesat-2/2A, LISS-III datasets and with the support of many partner Institutions. Nation-wide mapping of wetlands at 1:50000 scale provides current status of wetlands, its type, extent, size, location, distribution, as well as decadal changes. Wetlands inventory statistics along with geospatial analysis has been brought out in the form of an atlas titled “Space based observation of Indian wetlands”. Click here to Know more (PDF Size:471MB Language: English) |
|
|
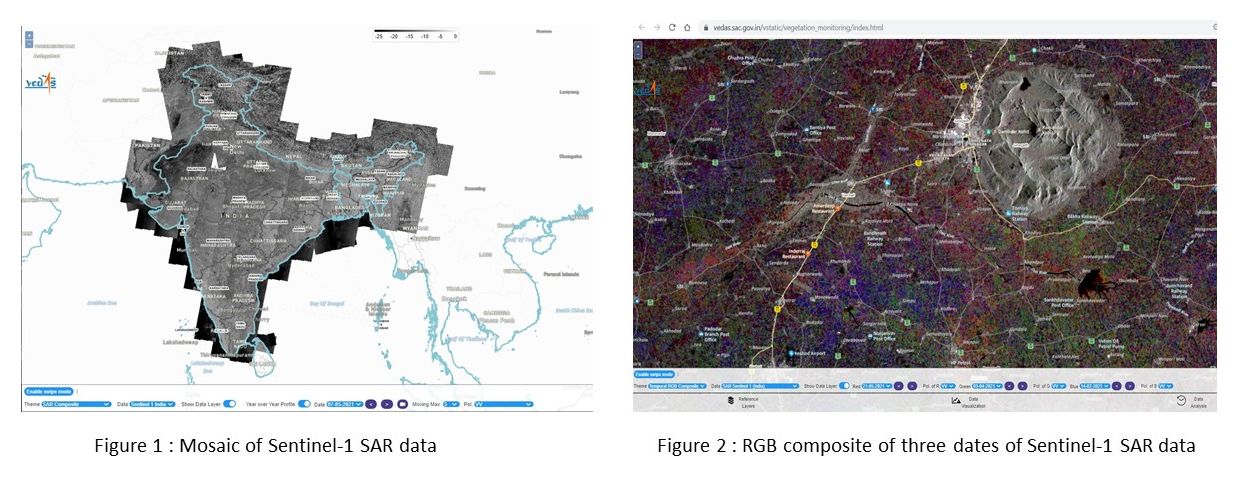
A fully automated procedure is now established for downloading, processing and publishing of Sentinel1-A&B SAR data on VEDAS.
The data Sentinel1_SAR(IW)_GRD is automatically downloaded from Bhoonidhi portal; processed using
SNAP tool and published on VEDAS for users. User can perform web-based visualisation and analysis
at very high speed.
|
|
|
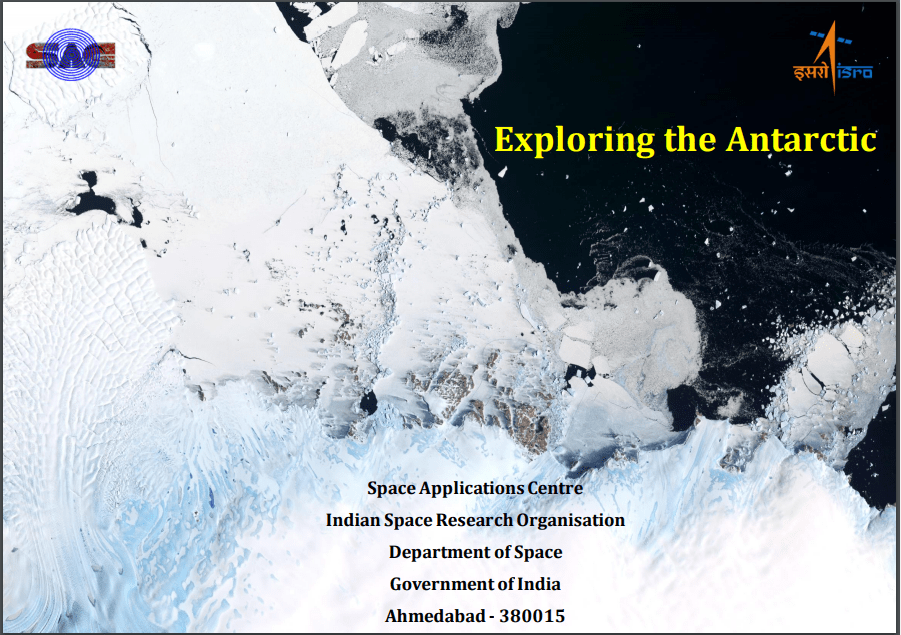
This book presents the highlights of various scientific studies in the Antarctic region undertaken by Space Applications Centre (SAC-ISRO) using the earth observation data and decade long experience (2009-2019) of participation in the expeditions to Antarctica coordinated by National Centre of Polar and Ocean Research (ESSO-NCPOR). The studies include technique development and analysis of sea ice, ice sheet and ice shelves using sensors launch by ISRO such as AltiKa, SCATSAT-1, OSCAT, MSMR, RISAT, AWiFS, LISS-III, LISS-IV etc. Field studies include measurements at Bharati and Maitri stations Click here to read book (PDF Size:35.1MB Language: English) |
|
|
Click here to Know more (PDF Size:418KB Language: English) |
|
|
Yaas cyclone induced flash floods influenced many low-lying areas in the coastal regions and changed the turbidity of the wetlands. Study was carried out to assess the impact of cyclone on various Hydrological aspects including surface inundation, rainfall, and water quality. Surface inundation was estimated using synthetic aperture radar Sentinel-1 and Advanced Microwave Scanning Radiometer (AMSR-2) dataset. Optical dataset of Sentinel-2 was analysed to understand the changes in the turbidity of the nearby rivers and lakes. Accumulated rainfall showed a high amount (> 300 mm) of precipitation received at the landfall location in Odisha during the period of 23 May 2021 to 28 May 2021. Heavy flooding was observed in the coastal districts of Orissa including Bhadrak, Kendrapara. Near Digha coast, a high amount of river discharge at the ocean mouth was observed in comparison to pre cyclone time. The turbidity of the water was also observed to be high due to sediments carried by the river. Click here to Know more (PDF Size:743KB Language: English) |

|
|
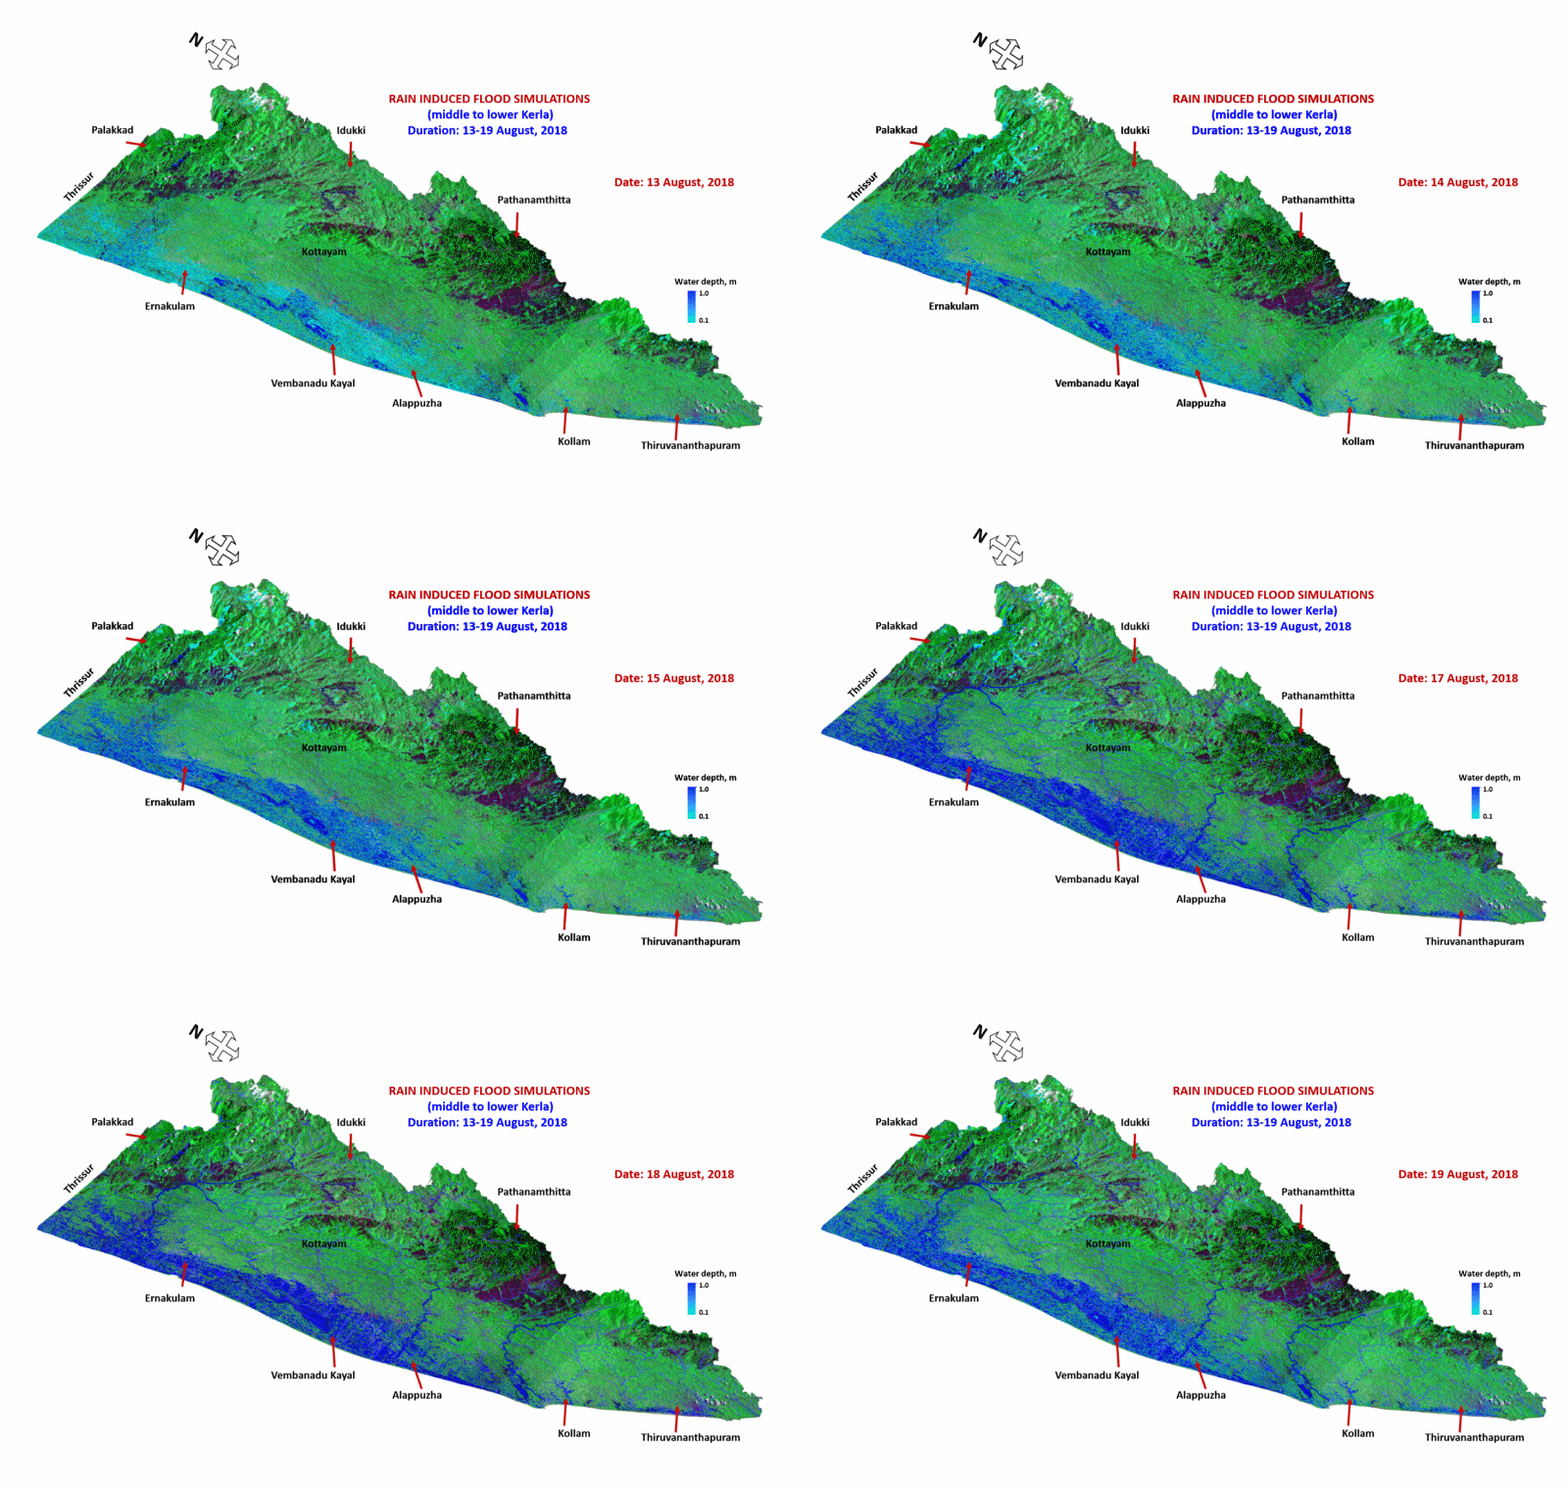
Flood is a devastating natural disaster experienced generally during monsoon months due to torrential rainfall over different regions of India. This not only leads to large impact on the socio-economic life of the country but also result in large-scale destruction of life and property. Click here to Downlaod PDF (PDF Size:667KB Language: English) |
|
|
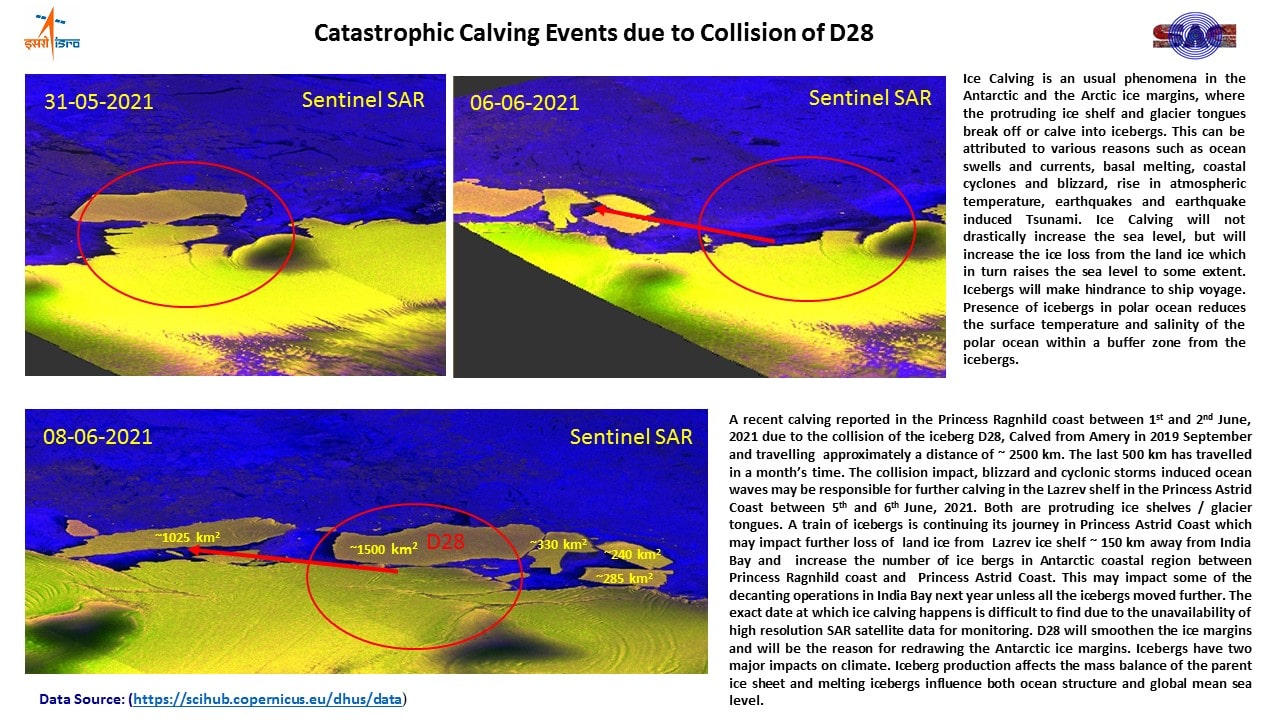
Rift Propagation and ice calving of Larsen C Ice Shelf in Antarctica. Calving of ice took place between July 10th and 12th. AMHTDG Team was watching the event closely. Ice disintegration was of the order of ~ 6200 km2 out of ~ 50000 km2. The event presently will not raise the sea level, but the instability of the shelf and increased ice flow from Ice Sheet may altogether change the scenario. Download Presentation (PDF Size:475KB Language: English) Download Report (PDF Size:3.35MB Language:
English)
|

|
The Android App for Solar Calculator is very useful to know the Solar energy potential at any given place. It also gives forecast for next 72 hours.
Click here to Know more|
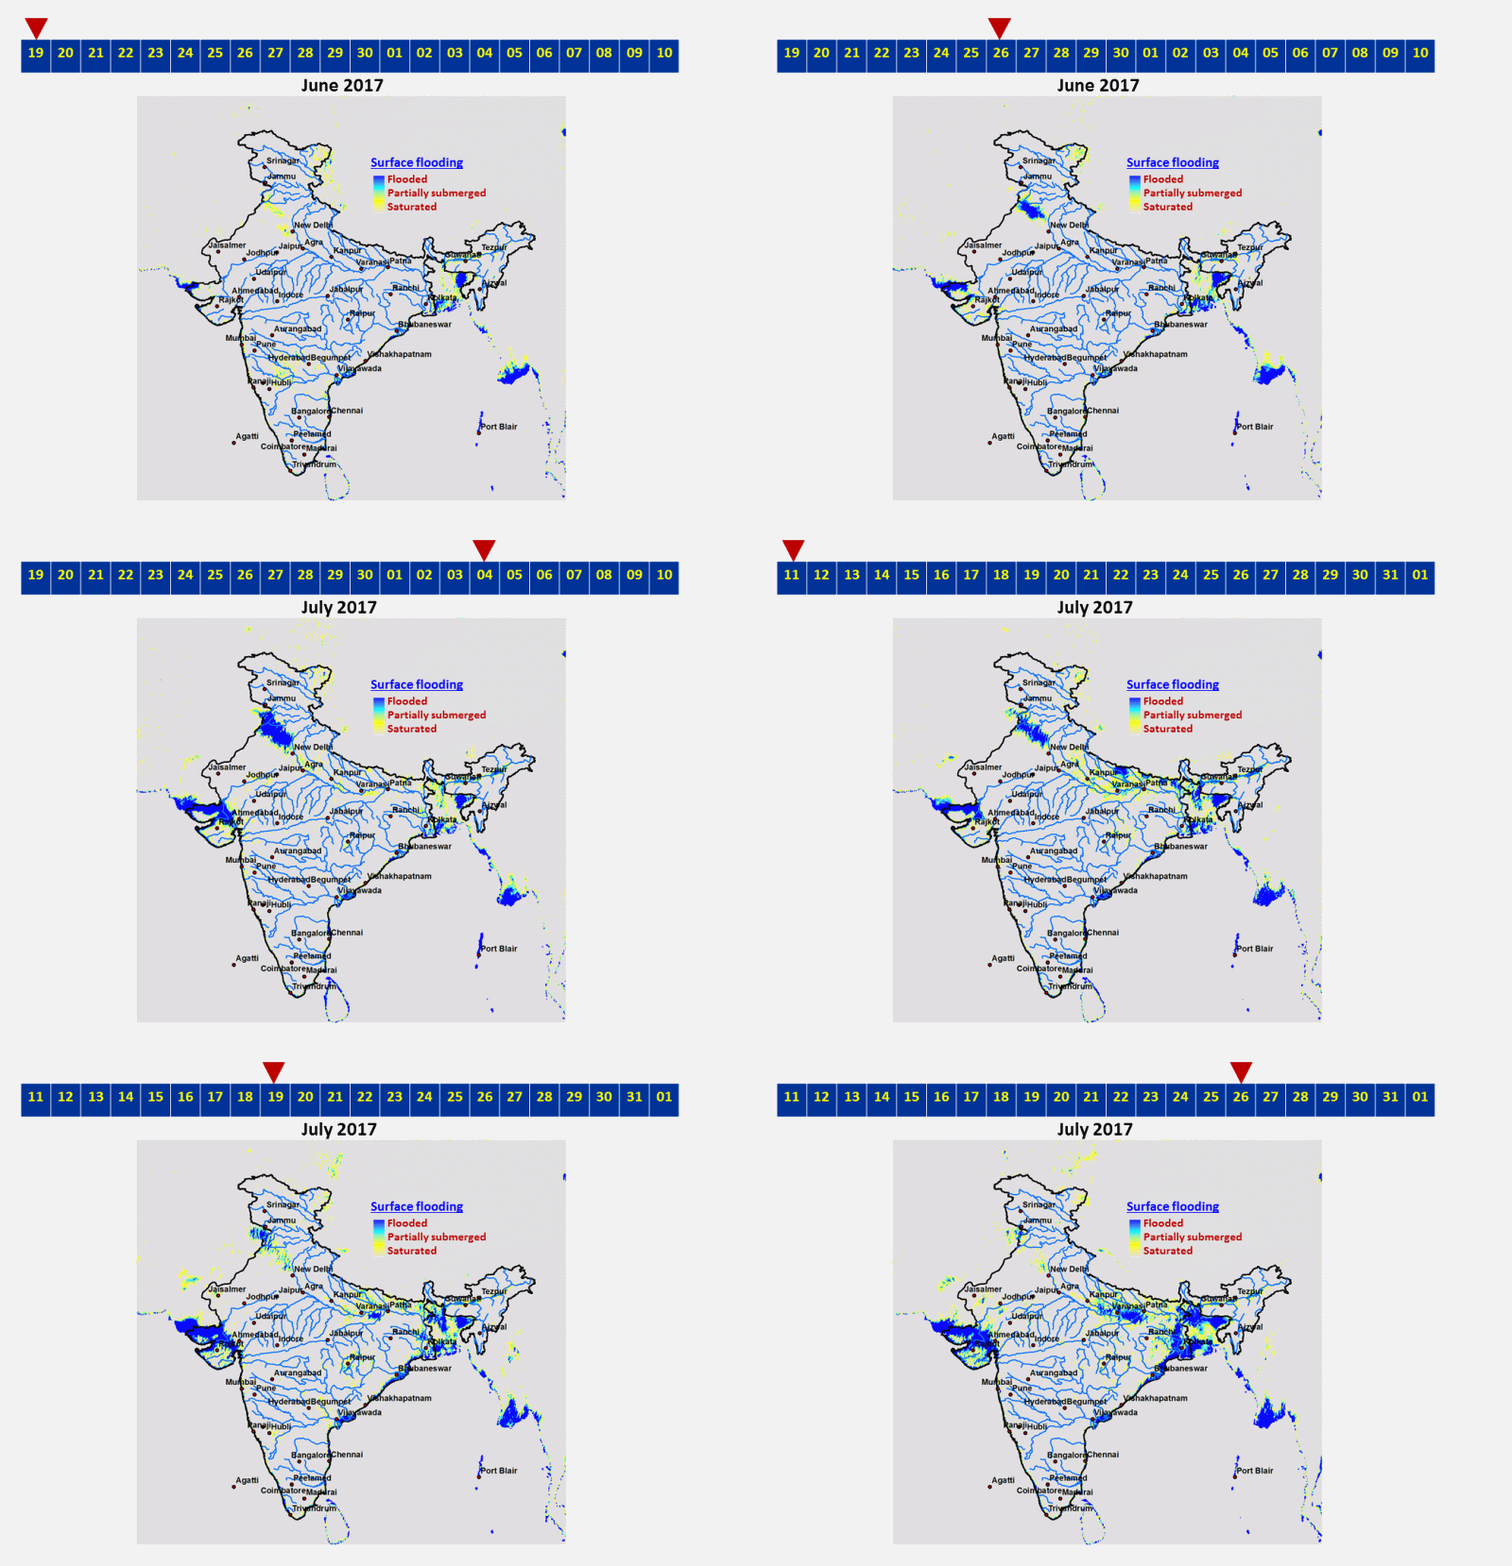
This animated gif shows flood progression and receding pattern over India during 19 June to 26 July 2017 using Ku band SCATSAT-1 observations. |
|
Scatterometer observations provide information on wetness which is modelled at the catchment scale to estimate basin wetness index and subsequently river water level fluctuations.
Download Full PDFShifting pattern of irrigation practices due to Punjab water act has been monitored using the passive microwave observations.
Download Full PDFThe optical depth of Martian atmosphere as a function of altitude derived above two opposing walls (Northern and Southern walls of the Valles Marineris near Coprates Chasma region) of valley from stereo images that were taken with MCC on December 5, 2014.
Download Full PDFThe albedo of the surface is defined as the fraction of incident solar radiation reflected by the surface. The magnitude and spatial distribution of Martian surface albedo are important inputs for characterization of Martian surface and Atmospheric circulation.
Download Full PDFThe North Pole of Mars has a large ice cap on it. Mars Colour Camera (MCC) on-board MOM captured many images of north pole of Mars. Topographically corrected MCC reflectance mosaic is prepared using nine MCC images observed during 16 December 2015 to 26 January 2016.
Download Full PDFUsing Mars Orbiter Mission-Mars Colour Camera (MOM-MCC), area of North Pole Ice Cap has been measured for retreat of Northern Polar Ice Cap during northern summer of Mars.
Download Full PDFSARAL-Altika is detecting water level fluctuations in 10 reservoirs since March 2013. A detailed study on Ukai reservoir reveals lowest water levels in 2016 as compared to previous years.
Download Full PDFMCC has acquired many high and low resolution images for Valles Marineris. The datasets from MCC for the study area were geo corrected by using MOLA data. During photometric correction total six images of the surface of Valles Marineris were processed.
Download Full PDF